


I. Overview of Online Dust Monitor
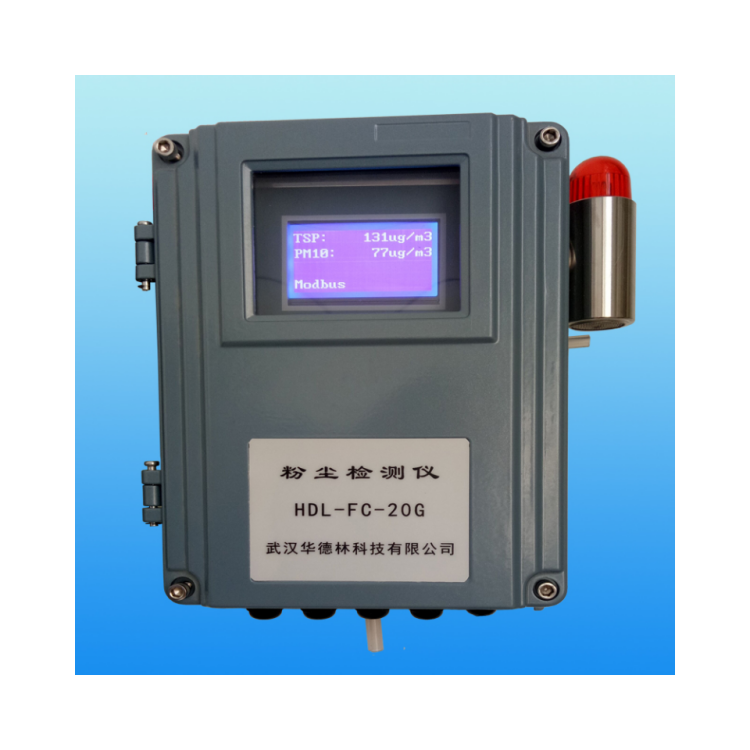
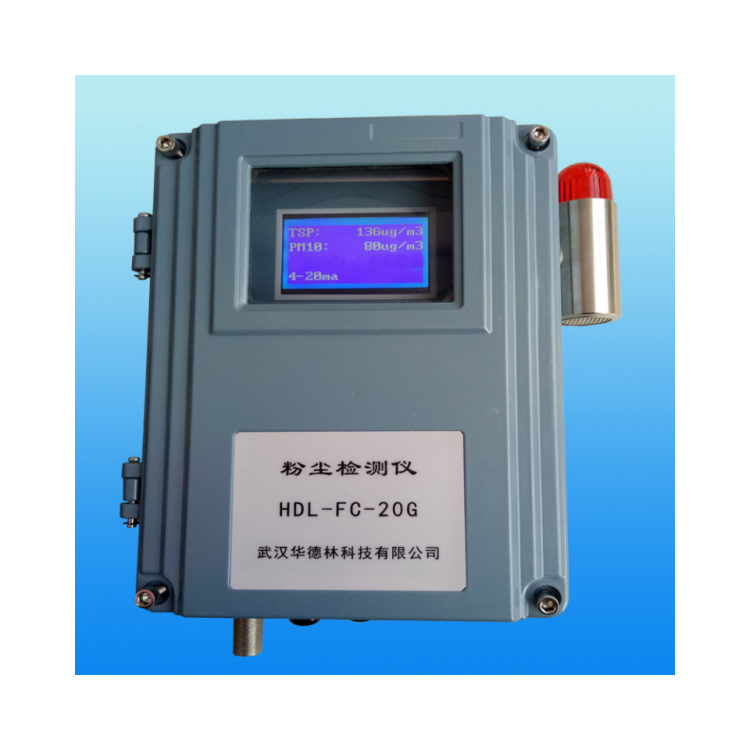
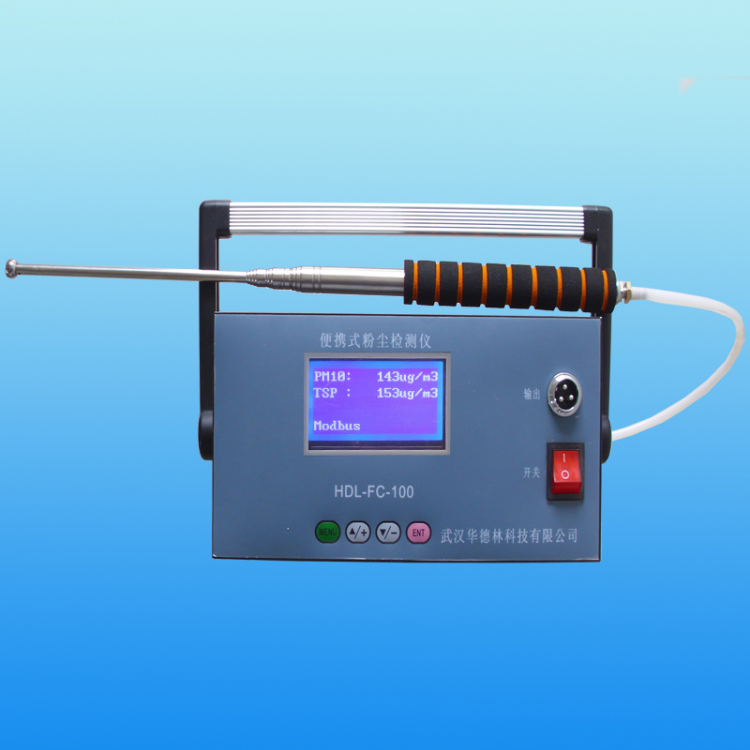
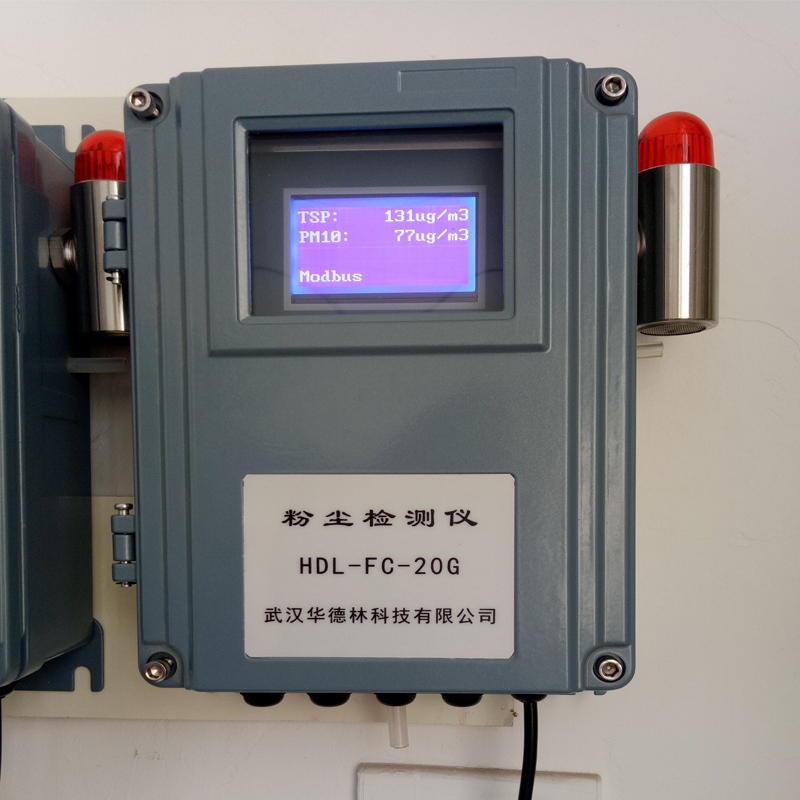
The HDL-FC-20G Online Laser Dust Continuously Monitoring Instrument (hereinafter referred to as the Online Dust Monitor) is primarily used for the concentration detection and over-limit alarm of dust particles (PM10 and TSP) in industrial and mining enterprises. This instrument draws in air containing dust particles from large public indoor spaces, industrial and mining enterprises, factory workshops, or production workshops, and analyzes it through a high-precision laser dust detection sensor. The concentration value of dust in the space is displayed on the instrument's screen.
HDL-FC-20G Online Laser Dust Continuously Monitoring Instrument, utilizing the principle of light scattering with a semiconductor laser as the measurement light source for high-sensitivity, non-contact measurement of dust in the air. Managed and controlled by a single-chip microprocessor throughout the testing process, featuring a high-resolution, large-screen, high-brightness LCD display with full Chinese language display.
Section II: Main Technical Specifications of Online Dust Monitoring Instrument
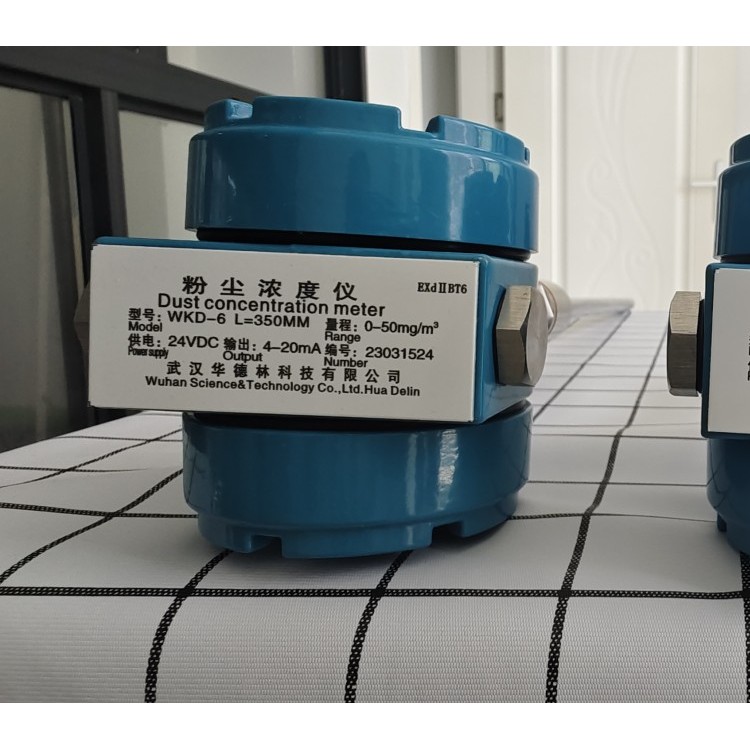
1. Dust Measurement Ranges: PM10 and TSP (PM2.5 optional)
2. Dust Measurement Range: 0.001~40.0 mg/m³; Custom specifications available.
3. Detection Sensitivity: 0.001 mg/m³; Repeatability Error: ≤±3%
4. Air Sampling Flow Rate: 2 L/min (0.1 ft³/min)
5. Sampling Time: 1 sec to 100 mins, manually adjustable at any time. Directly read dust quality concentration (ug/m3).
6. Features dust concentration overload alarm setting, allowing for self-adjustment of high-concentration alarm thresholds. Equipped with an internal buzzer, it can also be connected to external sound and light alarms. The switch quantity output can be connected to external exhaust fans. When the dust concentration exceeds the high threshold, the exhaust fan will automatically activate to reduce the dust concentration in the space.
7. Equipped with RS485 communication interface, switch quantity output, 4-20mA current output, capable of connecting to a computer for data transmission, remote monitoring, and printing detection results.
8. The instrument features a programmable clock chip, providing accurate date and time information for measurement. 9. It has an auto-cleaning calibration function.
10. Working Environment: Temperature (-30-75℃); Humidity RH (20-80)%
11. Operating Power: 220V AC; or 12V DC
12. Instrument lifespan exceeds five years
13. Dimensions: 280mm x 210mm x 100mm
14. Weight: Approximately 3kg.
Section 3: Features of Online Dust Monitoring Instruments
This instrument is compact, easy to install, boasts fast testing speed, high sensitivity, excellent stability, lightweight, simple operation, and is suitable for both AC and DC power. Ideal for large factories and workshop environments. Ensures safe production, real-time monitoring, and alarm functions.
Equipped with dust concentration overload alarm setting, allows for self-adjustment of high concentration alarm thresholds, built-in buzzer, and can be connected to external sound and light alarms. It also features switch output that can be connected to external exhaust fans. The exhaust fan will automatically activate when the dust concentration exceeds high levels, helping to reduce dust concentration in the space.
Section 4: Applications of Online Dust Monitor
HDL-FC-20G Online Dust Monitor, suitable for rapid measurement of inhalable particulate matter (PM10 and TSP) concentrations in public places, industrial and mining production sites, and environmental protection field monitoring of inhalable dust concentrations. Also used for evaluating air purifier purification efficiency. Real-time dust concentration detection in production workshops and factory interiors, with alarm function.
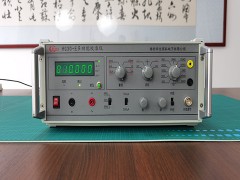
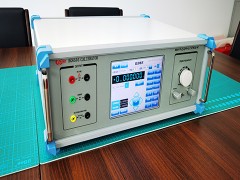
5. Online Dust Detector Instrument Structure Diagram

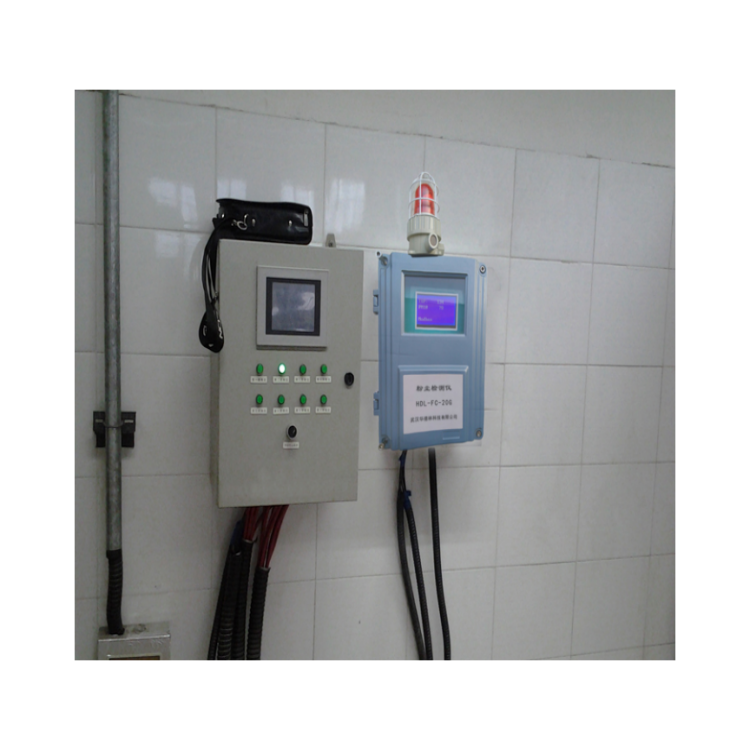
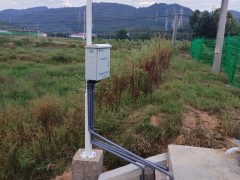
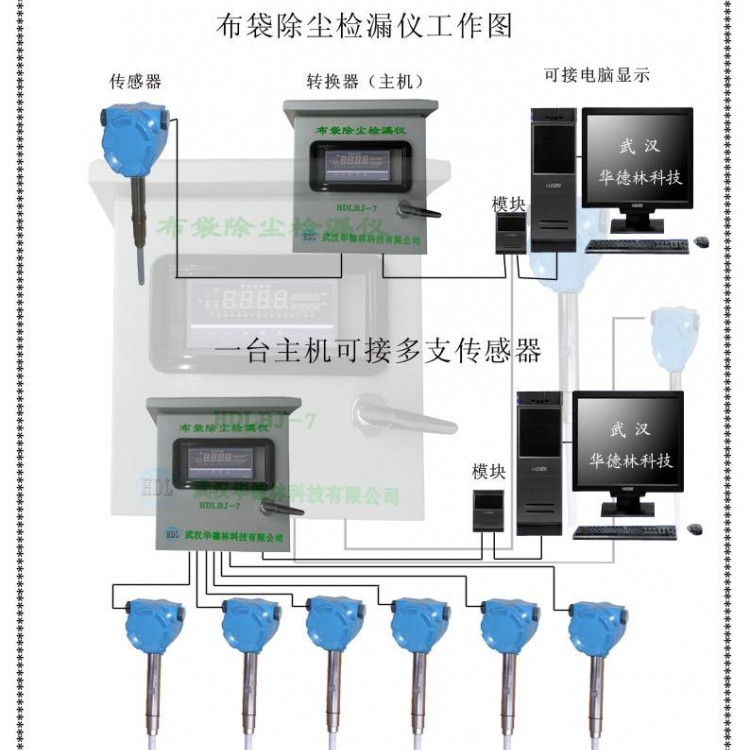
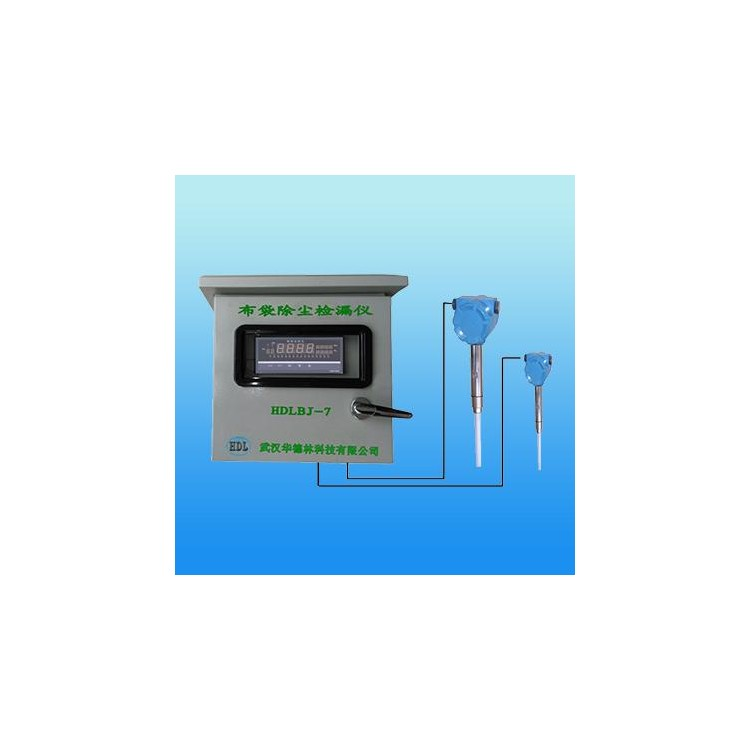
Section 6: Online Dust Detector Installation Diagram
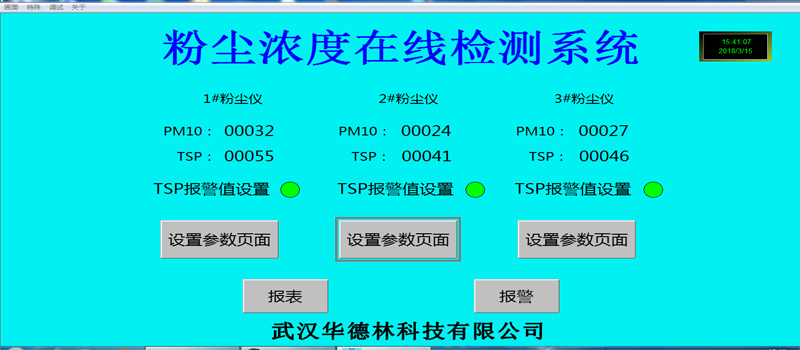
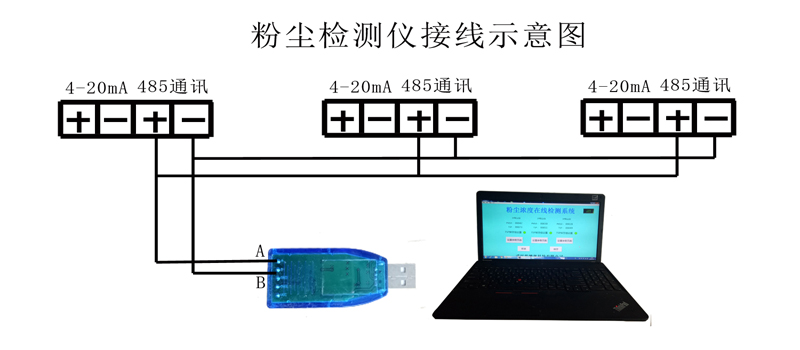
Dust Detector with Multiple Detection Points for Online Measurement and Monitoring System
One, with three inspection points as (connection diagram)

Part II: Monitoring Software Installation
Monitoring software is provided by our company (included on a USB drive).
2. Copy the surveillance software from the USB drive to your computer, double-click "Runsetup" on the USB drive, install it on your computer, and after installation, a "Touchview" icon will appear on your desktop.
Section 3: Connection of Multiple Dust Detectors to Computers
Connect the 485 outputs of each dust sensor to the control room computer using signal wires.
2. Connect the other end of the signal cable to the signal converter with a USB interface, A to the 485 signal "+", B to the 485 signal "-".
IV. Setup
1. Computer Setup
Insert the data converter into the USB port of the computer.
② Move the mouse cursor over "My Computer" and right-click. A dialog box will appear. Left-click on "Properties," then left-click on "Device Manager."
③ Pop-up screen
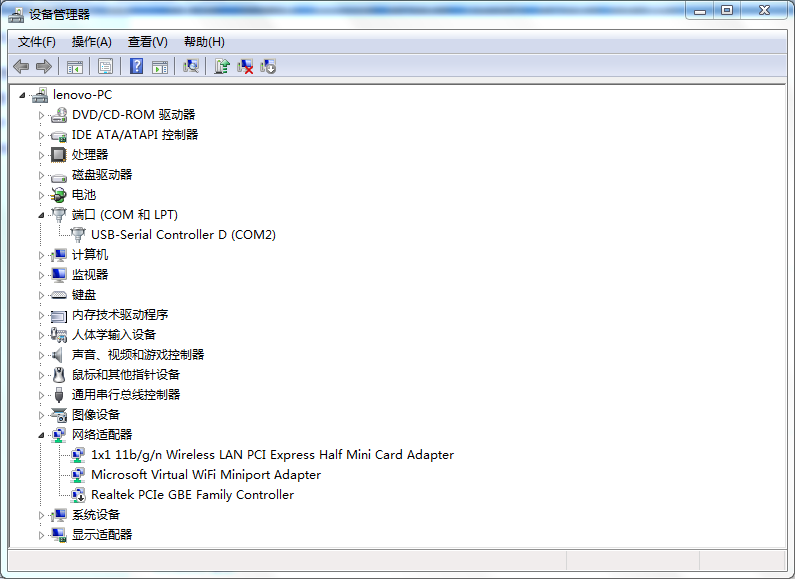
Left-click and double-click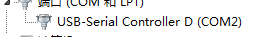
④ Click the left mouse button on "Port Settings" and set as shown in the figure below.
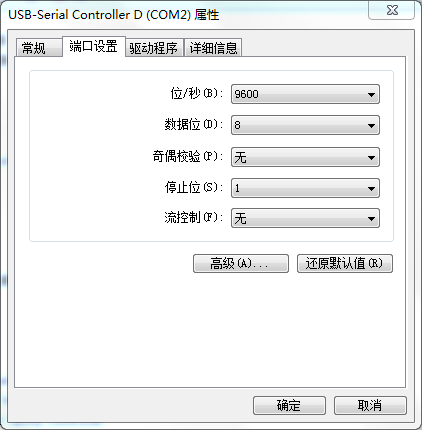
⑤ Left-click on "Advanced (A)…", select "COM2" under COM Port (p), click "OK", then continue to click "OK".
2. Software Settings
Double-click on the desktop Computer Display

② Alarm Point Setup
Left-click on "TSP Alarm Value Setting," enter the high alarm point, then click "Confirm."
At this moment: When the measured value by the instrument is lower than the set alarm value, the on-site flash alarm is activated, and the green light on the monitoring screen turns red.
③ Instrument Coefficient Setting
Left-click on the "Set Parameters Page" to modify the line table coefficients. The default factory coefficient is "0100". To change the coefficient, left-click on "0100" and modify the corresponding numbers. Return to the main page by left-clicking on "Main Page".
④ Report Settings and Queries
Left-click on "Reports" → "Query" → "Time Properties"
Set the Start Time for Viewing Set the End Time for Viewing
Set the interval time to view
⑤ Variable Selection
Left-click on "Variable Selection," then click "Historical Variables."
Select a variable from the left box, then click the "Right Arrow" in the middle to move it to the right box. Each gauge has two variables.
Note: Move all variables from several detection points to the box on the right.
After selecting, click "Confirm" and then click "Confirm" again.
⑥ Preserve
Save the data in an Excel spreadsheet format on your computer. Click on the square below the save path and filename, then enter the save path and filename.
Please click "Save" for the dust detector data from January.
3. Instrument settings
To align each gauge's reading with the readings on the computer screen, the address codes of the gauges need to be modified. Specific operation instructions are as follows, see gauge operation manual.
1# Dust Meter — Address Code "1"
2# Dust Monitor — Address Code "2"
3# Dust Analyzer —— Address code "3"