
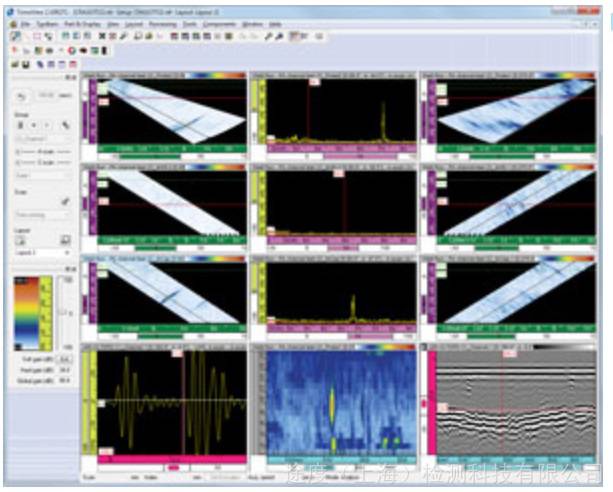


Data acquisition and analysis software for phased array detectionTOMNVIEW
Advanced analytical tools
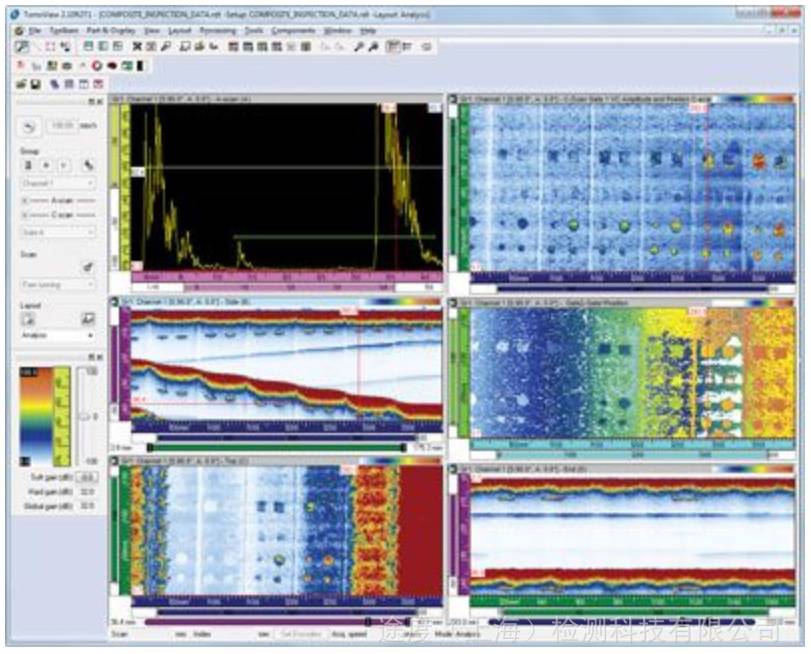
TomoView is not only a powerful design and acquisition software but also includes advanced analysis tools developed by Olympus, enabling users to gain a deeper understanding of the collected data. This makes TomoView a valuable assistant for users throughout the analysis and reporting process.
Whether it's simple defect quantification and reporting, or more in-depth analysis, TomoView can deliver as desired. Moreover, its flexible and comprehensive design allows for even more operations.
Unprecedentedly powerful performance
TomoView 2.10 software has added many new features, making it a high-quality tool that elevates the level of analysis to new heights.

Data file capacity has increased to 2 GB, and data from multiple files can be merged together, allowing for more effective analysis of data from larger surfaces.

Volumetric fusion of multiple volume views in the composite display can enhance data presentation and improve analytical efficiency.
Advanced algorithms
TomoView 2.10 offers advanced analytical algorithms for deeper analysis of collected data.

Robust noise analysis performance can quantify the signal-to-noise ratio and provide more detailed information about the detection conditions.

Comprehensive matrix filter performance for clearer display of C-scan data in noisy environments.
Data file integration
The TomoView data file merging feature combines multiple data files into one, allowing simultaneous analysis of these files, significantly enhancing analysis efficiency.
TomoView 2.10 allows each data file to store up to 2 GB, enabling the integration of more data files into a single file than ever before.

C-Scan Fusion
The C-scan fusion feature allows data from different C-scans to be combined within a single C-scan. The minimum amplitude detected across different C-scans, or the positions of these amplitudes, will be retained in the single C-scan.

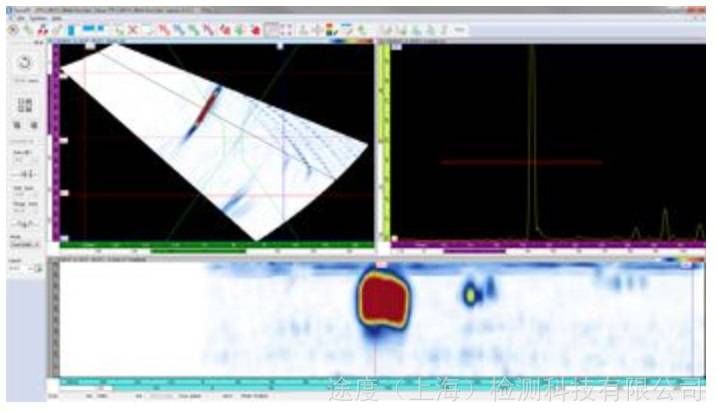
Volume Integration
The TomoView volumetric fusion feature can merge different sound beams within a single group, allowing for a clear representation of the entire workpiece being measured, and facilitating more convenient analysis of defect indications.
When there is space overlap, the amplitude is preserved. Therefore, the merged view displays all detected defect indications, regardless of the original direction of the defect indications.
Note that the indicator signal will vary due to different integrated resolutions used.

Matrix Filter


Matrix filter tools can be used to reduce noise in C-scan data by processing data points using surrounding points. The matrix filter is particularly useful in analyzing composite workpieces with high noise levels, thus providing clearer data visualization when dealing with data files with high noise levels.
Signal-to-Noise Ratio Tool
TomoView software includes Signal-to-Noise Ratio (SNR) functionality. Users can utilize the SNR analysis tool to assess the noise level in the reference area on the C-scan view, followed by calculating the surface area of defect indicators above the noise level.
In the Analysis Mode and Lite Aero version, the Signal-to-Noise Ratio (SNR) function is available. The SNR function is used for zero-degree detection, typically applied in aerospace industry inspections. This feature can be utilized in the top view (C), amplitude, and position C scan views.

Offline Data Optimization


Using the C Scan Editor software, users can now edit custom geometries based on the original collected data, and define their own focus areas for analysis, thereby providing greater flexibility for detecting complex geometries.
Binary Tools
The binary tool converts collected data into a "good/bad" view distinguished by color, allowing for simple analysis of pass/fail in data files.
This tool is particularly useful in applications that require visual analysis of collected data during the testing process.
Convenient report creation tools
Creating reports in TomoView has never been easier. With the area tool, you can add defect indicators. Select the defect report template you wish to use (easily customizable by adding readings and notes), then click "Add." Repeat this step for all relevant defect indicators.
Easily modify the company logo and add specific inspection details, such as operator name, location, and workpiece information. This allows you to create a complete HTML report with all relevant inspection settings in just a few seconds.

After report creation, the defect report is automatically saved to a .R01 file for future upload to TomoView.