


Product Features
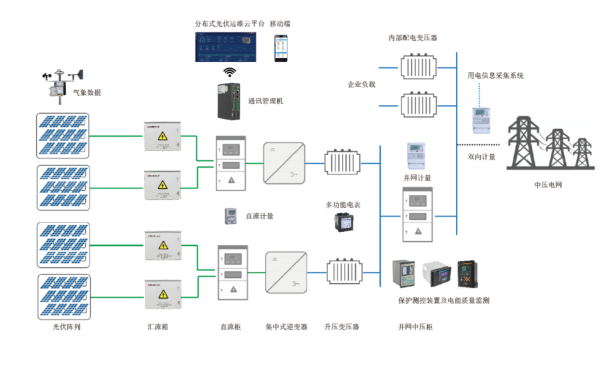
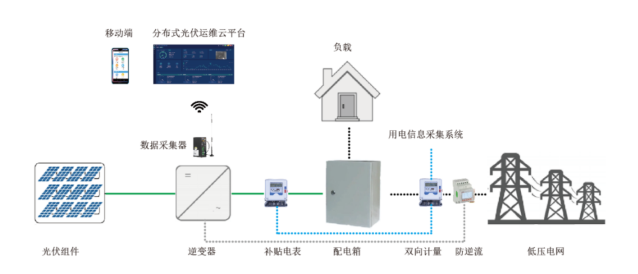
According to the National Grid's Q/GDW1480-2015 "Technical Regulations for Grid Connection of Distributed Generation": The voltage level for grid connection of distributed generation can be preliminarily selected based on the installed capacity at each connection point, with the following recommendations: 8kW and below can be connected to 220V; 8kW to 400kW can be connected to 380V; 400kW to 6000kW can be connected to 10kV; above 5000kW to 30000kW can be connected to 35kV. The voltage level for grid connection should be determined based on grid conditions through a technical and economic comparison and justification. If both high and low voltage levels are available for connection, the lower voltage level should be prioritized.
1. Comprehensive Dashboard - Display of PV Power Plant Locations, Number of PV Power Plants, Peak Power Generation, and Real-Time Power Generation Display; Statistics of Daily, Monthly, and Annual Power Generation for All PV Power Plants; Calculation of Standard Coal Savings and Carbon Dioxide Emission Reduction; Bar Chart Showing Monthly Power Generation
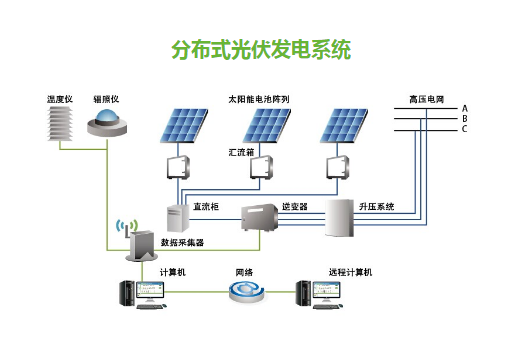
2. Power Plant Status - Display basic parameters such as power generation capacity and peak power of photovoltaic power plants - Statistics daily, monthly, and annual power generation of current photovoltaic power plants - Real-time camera monitoring - Connect to environmental parameters such as irradiance, ambient temperature and humidity, and wind speed - Show the number and basic parameters of inverters connected to the current photovoltaic power plant
3. Inverter Status - Basic Inverter Parameters Display - Daily, Monthly, and Annual Power Generation Display - Inverter Power and Environmental Irradiance Curve Display via Graph - DC Voltage and Current Query - AC Voltage, Current, Active Power, Frequency, and Power Factor Query
4. Power Station Generation Statistics - The list provides daily, monthly, and annual generation data for all photovoltaic power stations, with options to switch between bar charts and line graphs for display, as well as an export report feature.
5. Inverter Power Generation Statistics - Tracks the daily, monthly, and annual power generation of all inverters in the current photovoltaic power station. Supports switching between bar charts and line charts for display, as well as exportation of reports.
6. Inverter Curve Analysis - Displays the DC voltage and current curves of the inverter, the AC power curve, as well as the environmental irradiance curve and temperature curve. Facilitates overall analysis for users.
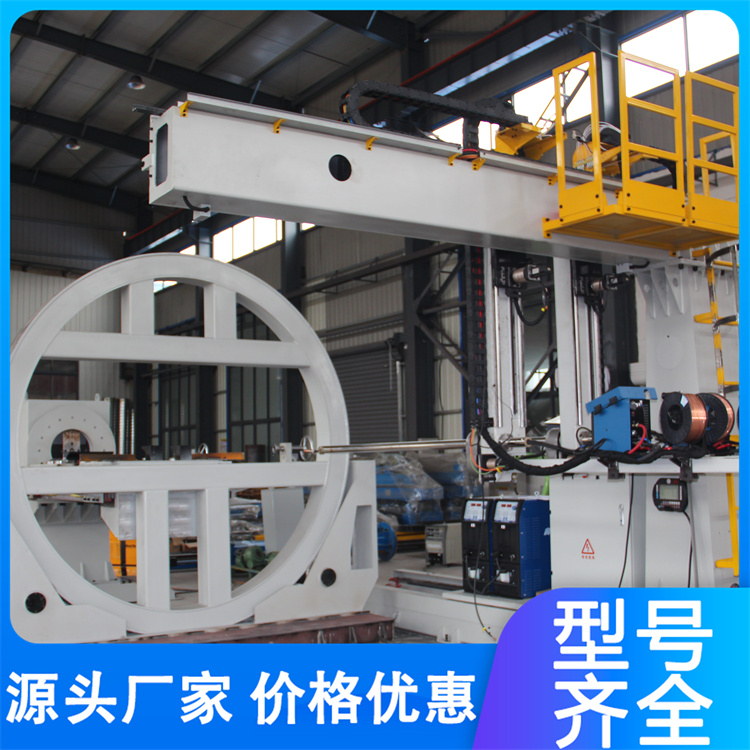
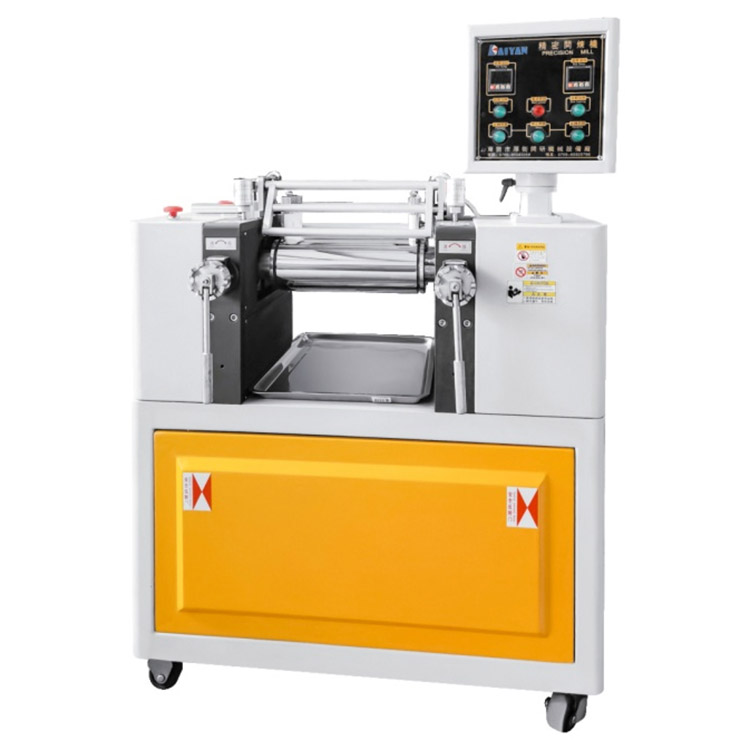
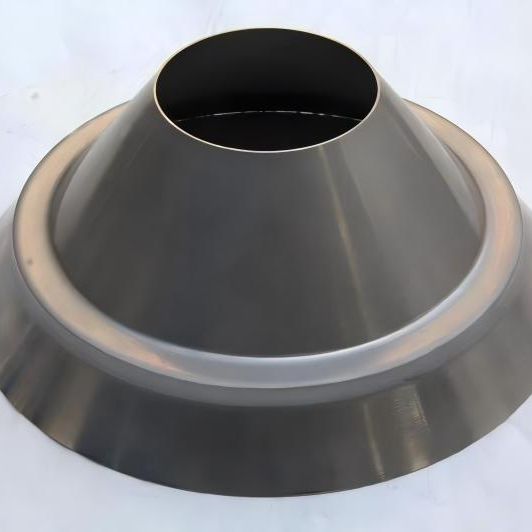
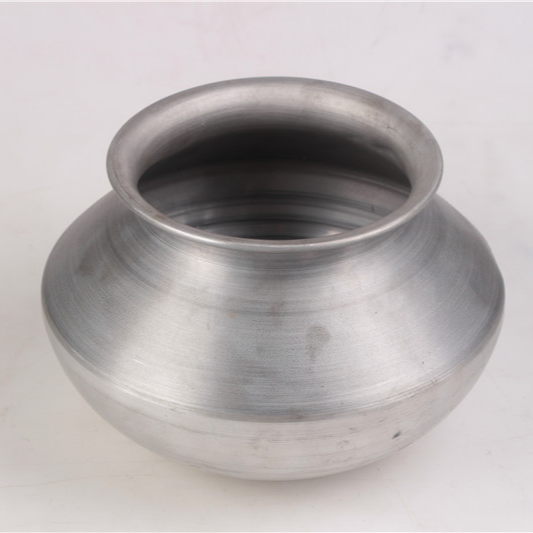
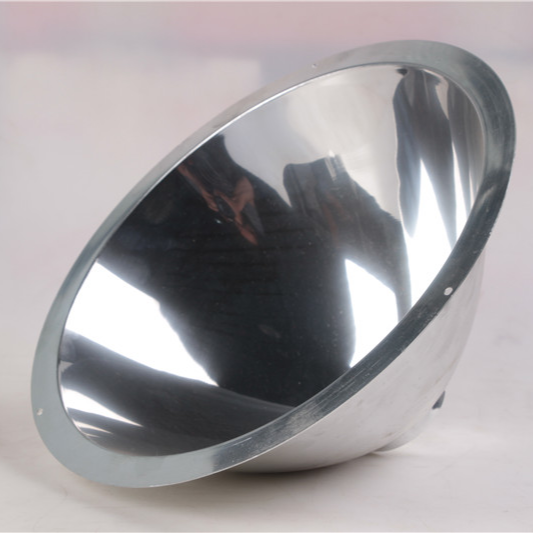
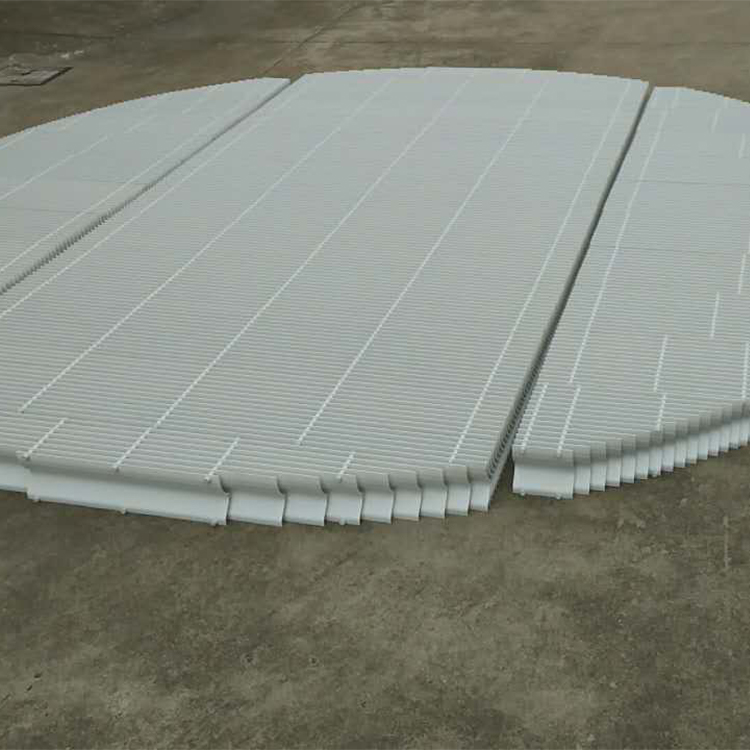
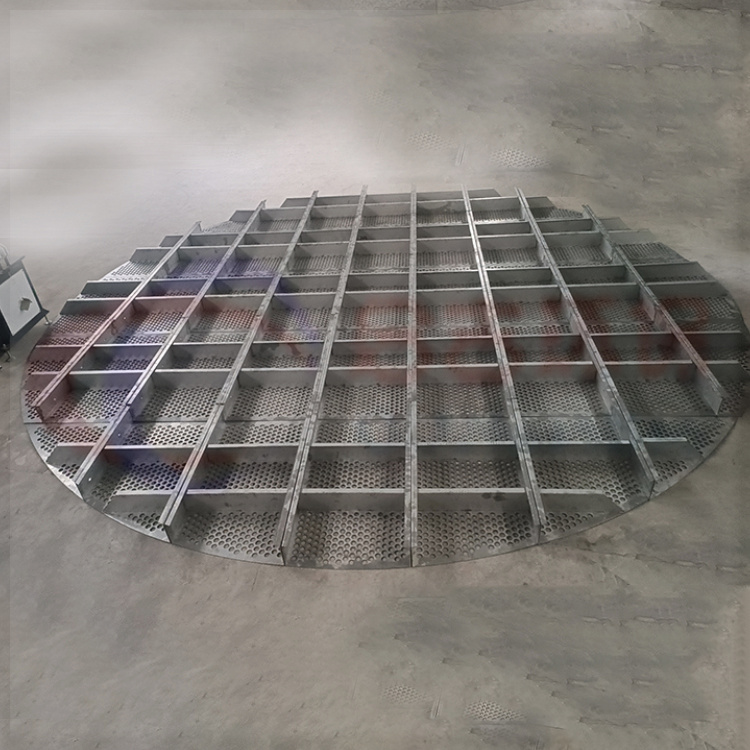
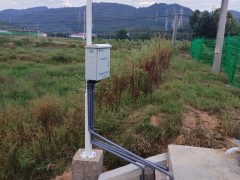
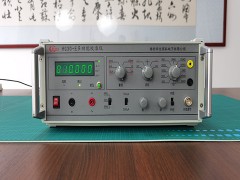
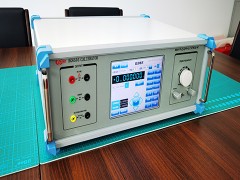
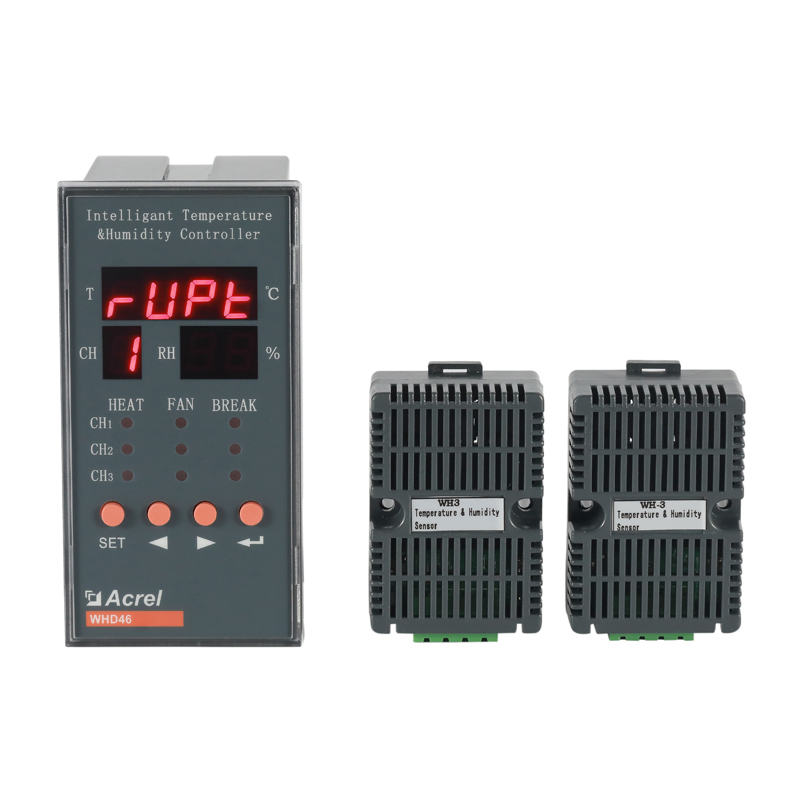
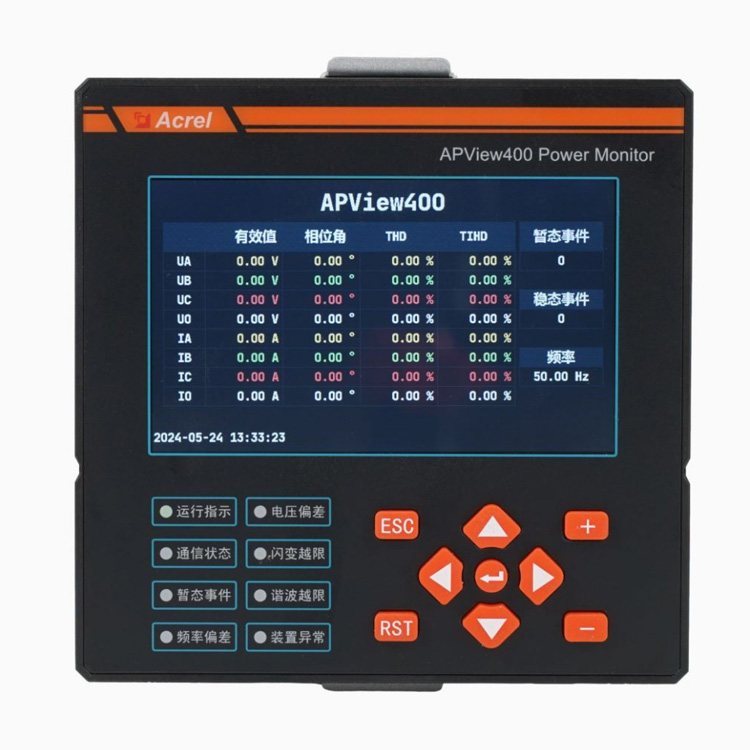
Product Actual Photos