


- AllProduct Category
-
Rock Triaxial Testing Machine
Load Testing Instrument
Direct Shear Device
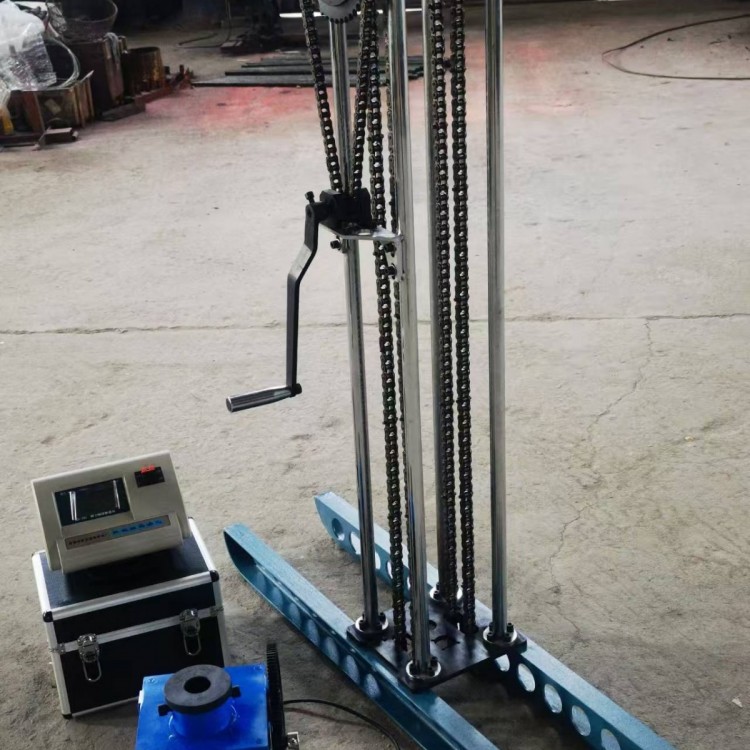
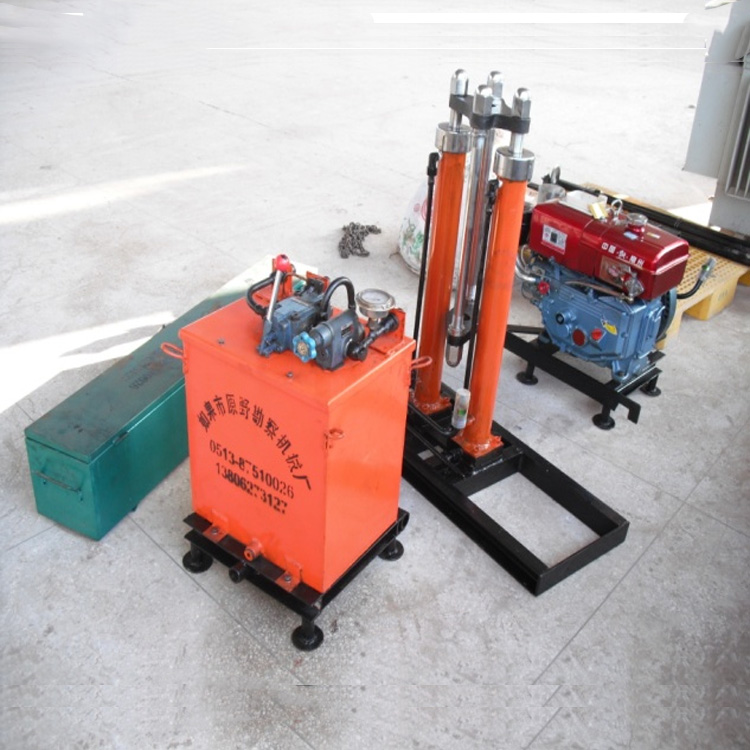
Power Probe
Point Load Tester
Static Penetration Tester


详情描述
One,Introduction:
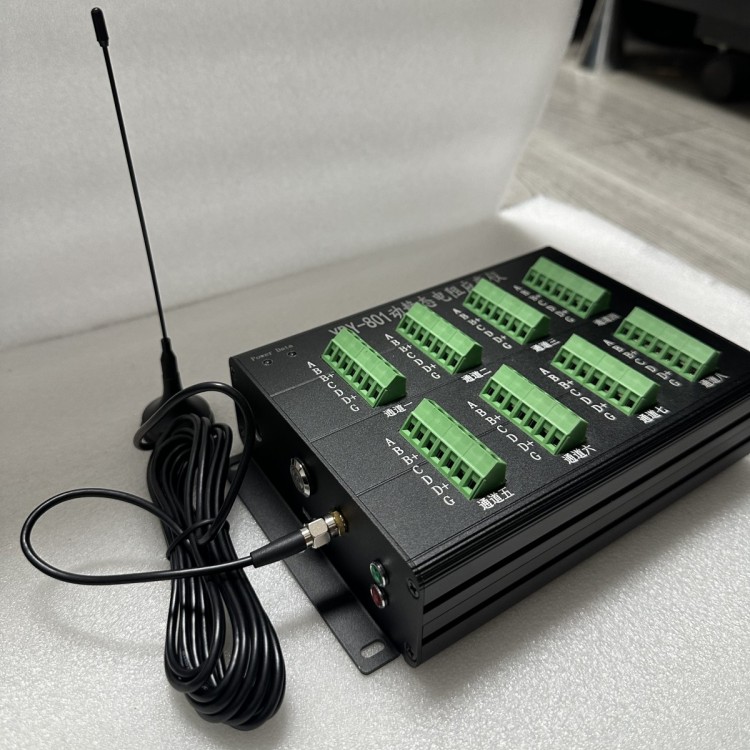
JT-8210 Wireless Static Strain Testing and Analysis SystemA strain testing and analysis system for various resistive strain gauges and strain gauges, including full-bridge, half-bridge, and quarter-bridge configurations. The system is entirely designed with a new approach.Adopt4G Upload Cloud Platform, 4G Remote Computer Software Collection。
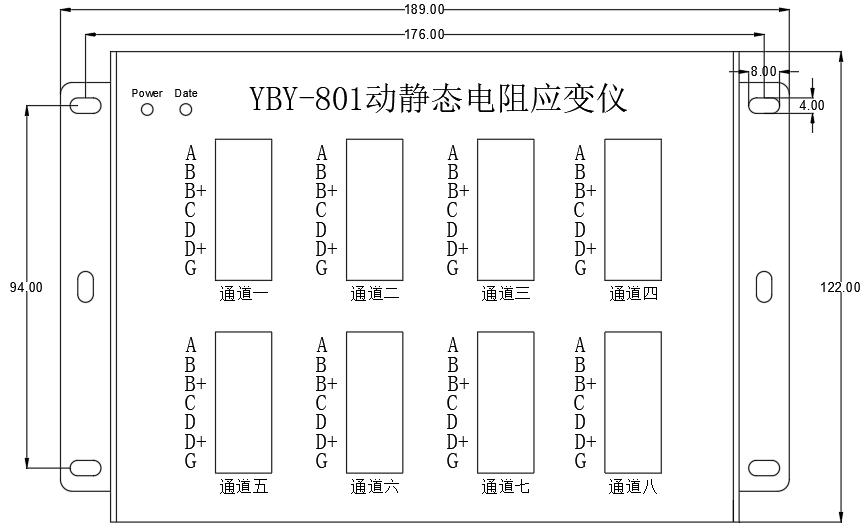
Image1 Data Logger Panel
Two,Connect sensor
Sensor connections as shown2Shown.
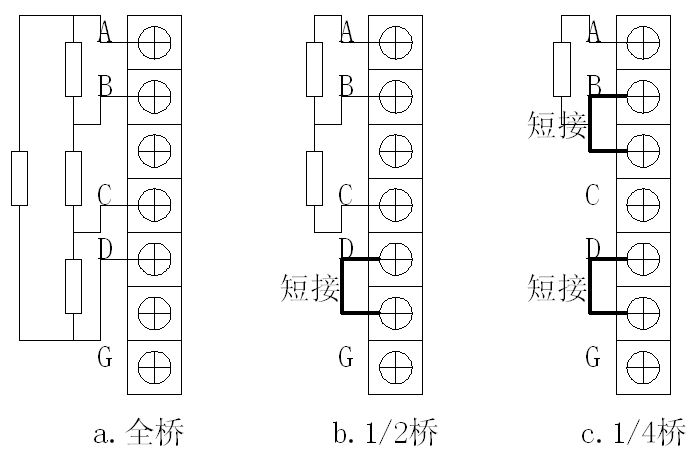
Image2 Sensor wiring diagram
aBridge Sensor Wiring: Bridge Sensor4+1Root wire4Each root signal line is connected to the terminal.A、B、C、DAbove, if there is a shielded wire, please connect it toGUp.
b.1/2Bridge sensor wiring:1/2Bridge sensor3+1Root wires, respectively, are3The root signal line is connected to the terminal.A、B、CUp, toDInstead of short-circuiting the lower terminal, if there is a shielded wire, please connect it toGUp.
c.1/4Bridge sensor wiring:1/4Bridge sensor2Root wires, respectively connected to the terminal blocksA、BUp, please.BInstead of short-circuiting the terminal below, connect toDShort the terminals below the one in question.
Note: When connecting the sensor, please turn off the instrument's power as much as possible. If the experiment has already started and you cannot turn off the power while wiring, please be careful not toA、CTwo wires are touching each other.
Section 3: Data Collection
1、OpenYBY-801Power supply for collector, press the silver button on the left to turn on/off. The red indicator light illuminates to indicate the platform is connected and operating normally.
IV.Cloud Platform Login
In the web browser, typeIPAddress:http://data.cloud.zhlmyfw.com:9527/Open the cloud platform in your browser, as shown2As shown.

Image2 Cloud Platform Login Window
Enter the username in this window.“ZGDZKXY01",password"123456". Enter the diagram3Equipment Selection Window. This window will display all devices under the user account.
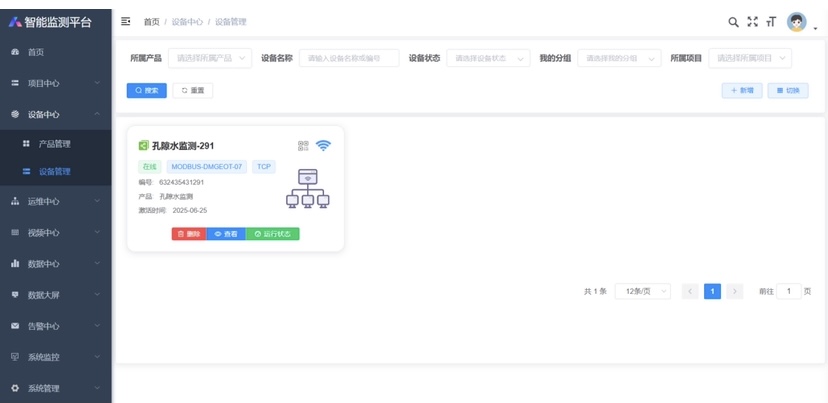
Image3 Equipment Selection Window
Five.Cloud Platform Data Browsing
In the figure3In the window, clickData Center Monitoring Data Items,Select the project established by the user device on the left, choose the measurement point, Presence of Image4As shownDataDisplay window.
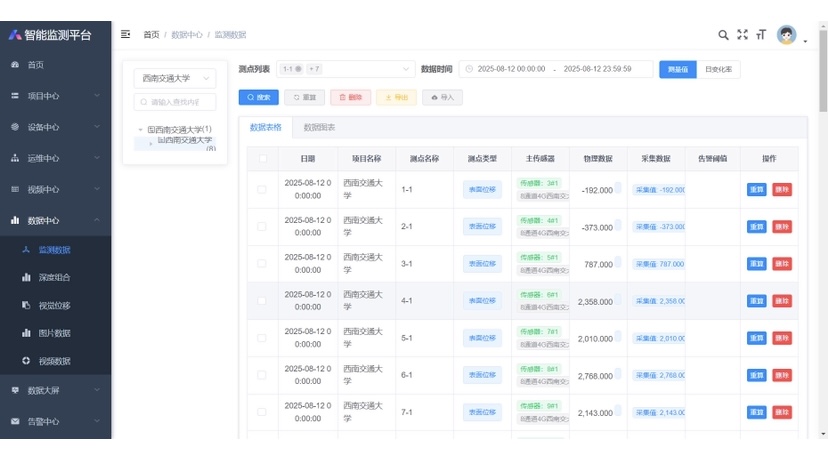
Image4 DataDisplay Window
Users can toggle between data display and graphic display functions. The graphic window is as shown below.5As shown.

Image5 The data table shows
SixCloud Platform Data Download
Click Image6China“ExportPress the button to download the current user-selected data. The data format isEXCL。
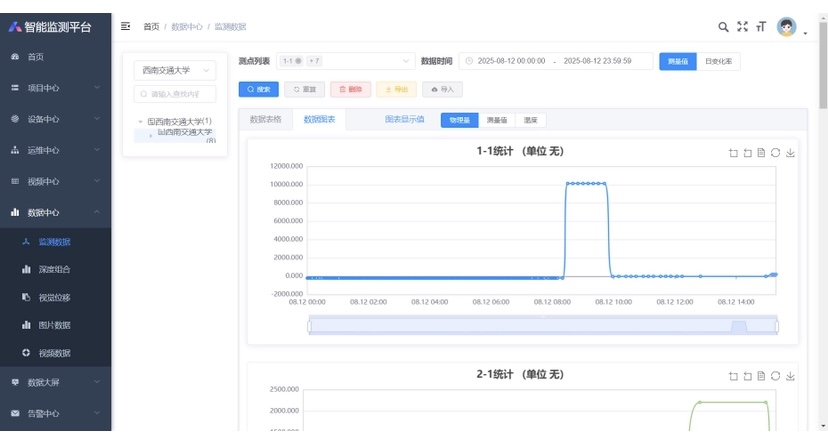
Image6
询价单

