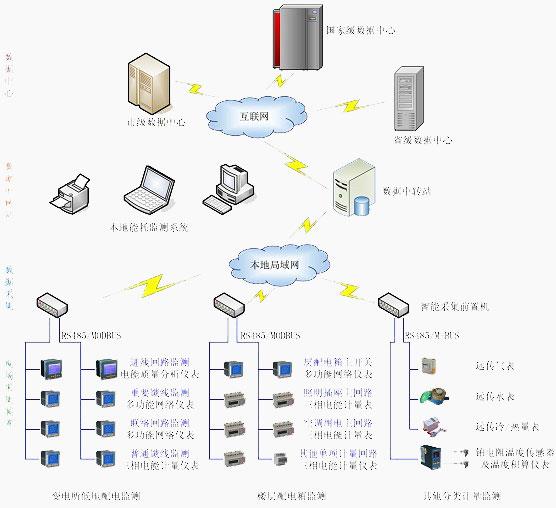


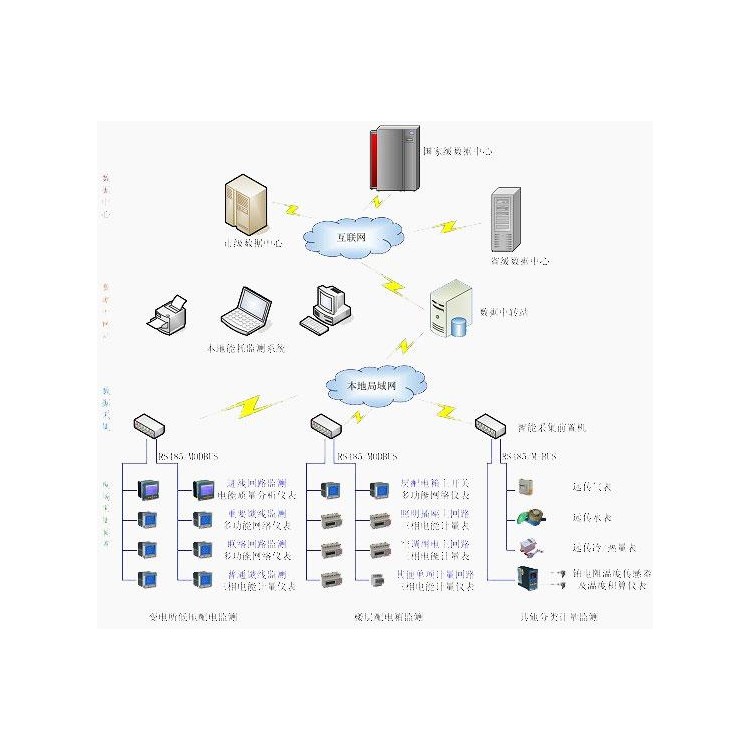
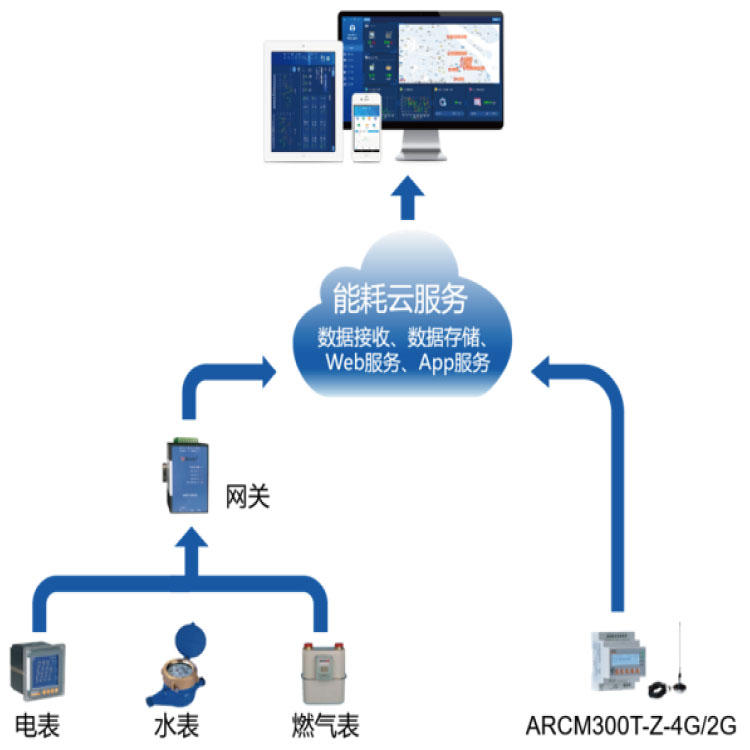


Energy consumption monitoring system architecture
The Acrel-5000 energy consumption monitoring system of Ankerui is based on the practical situation of the building site. The overall network structure adopts shielded twisted pair cables directly connected to the backend energy consumption gateway, and then uploads the data to the monitoring host through TCP/IP network.
The system mainly adopts a layered and distributed computer network architecture, as shown in the system architecture diagram: station control management layer, network communication layer, and field equipment layer. The building's instruments are scattered in the distribution room and on each floor. All instruments are laid through 485 shielded twisted pair cables to the security guard, and then through the energy consumption gateway to the system host to complete the collection and management of instrument data.
System software module
Comprehensive energy consumption main interface
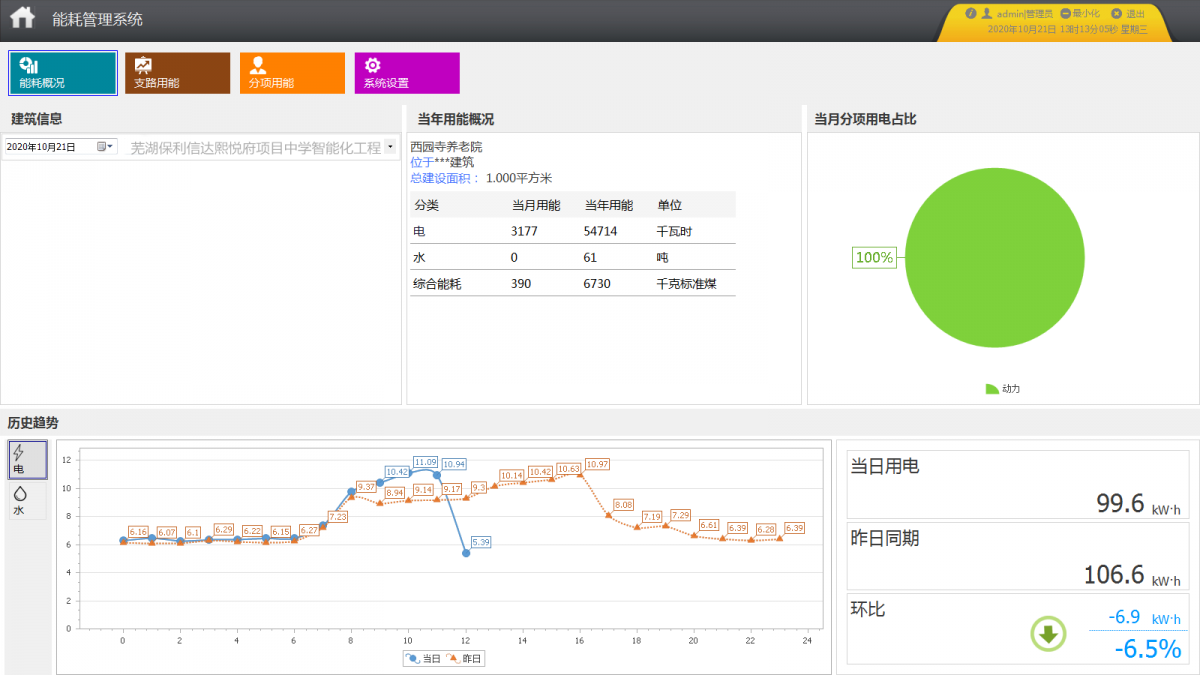
The main page displays the building's architectural images, basic information, monthly electricity consumption pie chart, and various energy consumption of the building. Based on the selected building, stop loading its building images, select a time to view the building's energy consumption status, automatically refresh after selecting the building or time, and default to the current day.
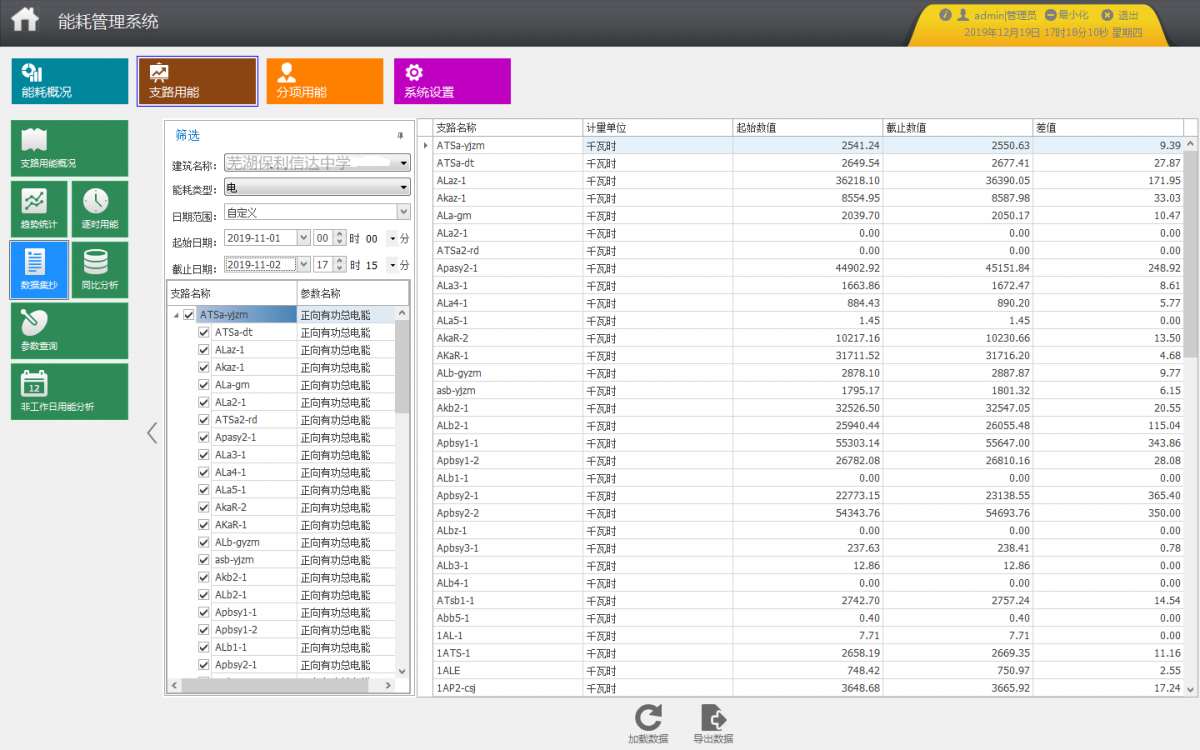
Branch energy consumption
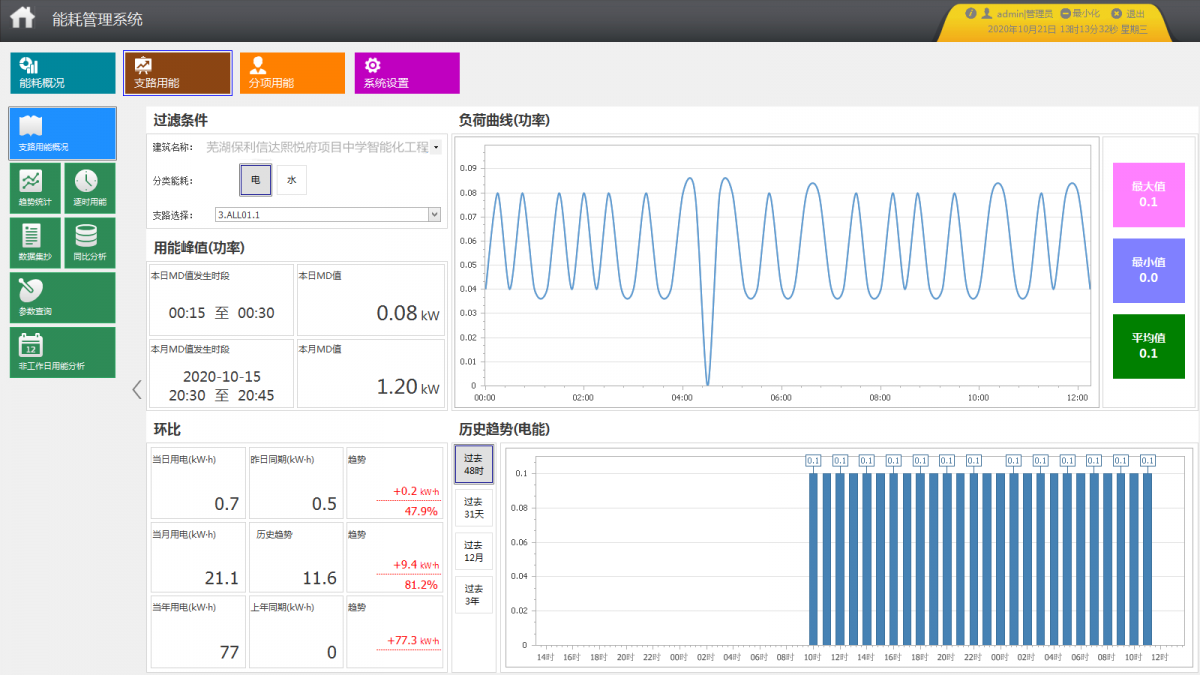
The system can calculate the daily, weekly, monthly, quarterly, and yearly energy consumption of each branch during a certain period of time. The system can view the energy consumption trend of each branch, stop querying based on existing dates or custom times, and display the total energy consumption of each branch in a chart format.
Sub item energy consumption statistics
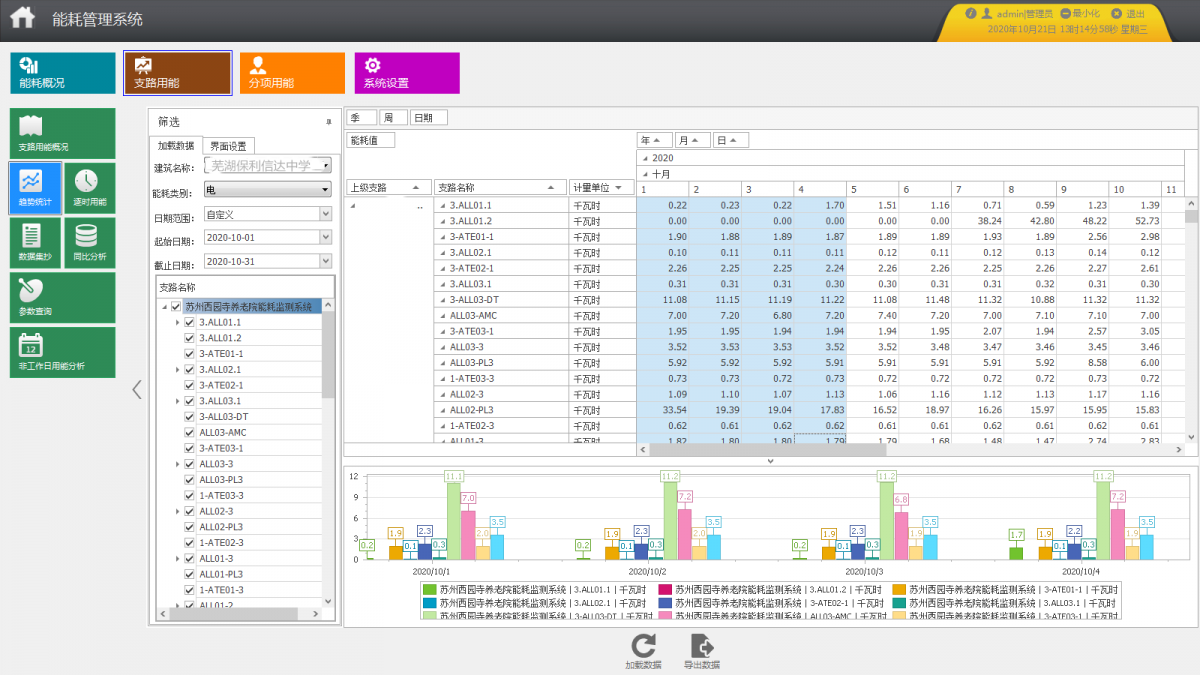
The system can stop energy consumption statistics and display according to sub items. Among them, the year-on-year analysis chart of daily energy consumption shows the bar charts of daily and yesterday's energy consumption for different sub items (blue bars represent today, green bars represent yesterday); Display the energy consumption proportion of each sub item in the past 31 days using an energy pie chart; The stacked chart displays the energy consumption trends of each sub item over the past 31 days; The sub item energy consumption ranking chart displays the top 10 branches with corresponding energy consumption values for the selected sub item.
Itemized energy consumption report
The system can calculate the daily, weekly, monthly, quarterly, and yearly energy consumption of each sub item during a certain period of time. The energy consumption trend of each branch in the sub item can be viewed, and queries can be stopped based on existing dates or custom times. Statistical data can be exported to Excel.
configuration options
Configure the fundamental information of buildings according to relevant technical standards, such as building function, building area, air conditioning area, building address, etc. The information of building area will be analyzed based on the energy consumption per unit area;
Basic information such as the type, model, and manufacturer of the instruments used in the configuration project, and the monitoring parameter information that can be provided by this type of instrument should be added. The configuration status here affects energy consumption statistics, time-based energy consumption statistics, and parameter query functions;
Configure all measuring instruments used in the project, keep the address, transformation ratio, corresponding collector, code, monitoring circuit title and other information of the measuring instruments;
When configuring sub item energy consumption statistics, information such as meters, proportions, and calculation methods can be sensitively configured based on project conditions. This configuration information will affect the functionality of the energy consumption analysis module for each classified energy consumption sub item;
Configure the corresponding measuring instruments, calculation methods, proportions, and departmental energy consumption plans for each department. After completing this configuration, the departmental energy consumption analysis function module will be activated;
Configure the measuring instruments, calculation methods, and proportion corresponding to a certain energy consuming area in the building. After completing this configuration, the regional energy consumption analysis function module will be activated
Outlook for the future
Based on the analysis of the energy consumption operation effect of the building, establish a typical energy consumption analysis model and conduct a unified analysis.
Establish a building energy consumption measurement system: Monitor the electrical structure of the building up to the level of the distribution room, accurately count the incoming and outgoing circuits, and meet the principle of energy conservation, that is, the incoming electrical energy is the sum of the outgoing electrical energy (with an error rate of about 3%).
Storage of collected data and creation of visual charts: The system collects data and stores it in the database, which can meet the requirements of report queries and exports. The system can also display energy consumption trends through bar charts and other methods, providing customers with a better experience.
Diagnose high energy consumption points: Management personnel can collect data through the system and conduct targeted year-on-year and month on month analysis of each circuit. After a stage of analysis, high energy consumption points can be identified.
Through energy consumption analysis, the management and operation form has been improved: the building has targeted high energy consumption points and implemented targeted management operations, such as notifying each team to turn off lights and machines during off hours, and including them in performance evaluations; During work, the circuit with high electrical load can be staggered to reduce excessive load at the same time; Energy consumption data can reduce building operating costs.