


- AllProduct Category
-
X-Ray Analyzer
Radon Detector
Radiation Detector
Gamma Spectrometer
石油录井仪


详情描述
1. Basic Theory
Common methods for uranium measurement include spectrophotometry, colorimetry, and laser fluorescence. For plutonium, common methods include alpha counting, alpha energy spectrum, and X-ray counting. However, these methods are cumbersome and time-consuming during hot sample analysis and sample pretreatment, and they cannot directly measure uranium and plutonium. After chemical pretreatment of the samples, uranium and plutonium can be measured effectively and quickly using graphite crystal pre-diffraction X-ray fluorescence analysis.
In our post-processing analysis in China, the X-ray fluorescence (XRF) method has been less commonly used in the past. The primary reason is that the samples themselves have inherent radioactivity, which causes significant interference in measurements. By employing Graphite Crystal Pre-Diffraction Energy Dispersive X-ray Fluorescence (EDXRF) analysis, the issue of radioactivity interference is effectively addressed, with the detection limit for U reduced by about one order of magnitude compared to conventional EDXRF. Our independently developed Graphite Crystal Pre-Diffraction EDXRF analyzer is designed by carefully integrating a graphite crystal diffractor between the sample and detector of a standard Energy Dispersive X-ray Fluorescence setup, to eliminate the influence of the sample's radioactivity. This makes it suitable for measuring solutions in the post-processing of spent fuel. It can be widely applied in post-processing analysis.
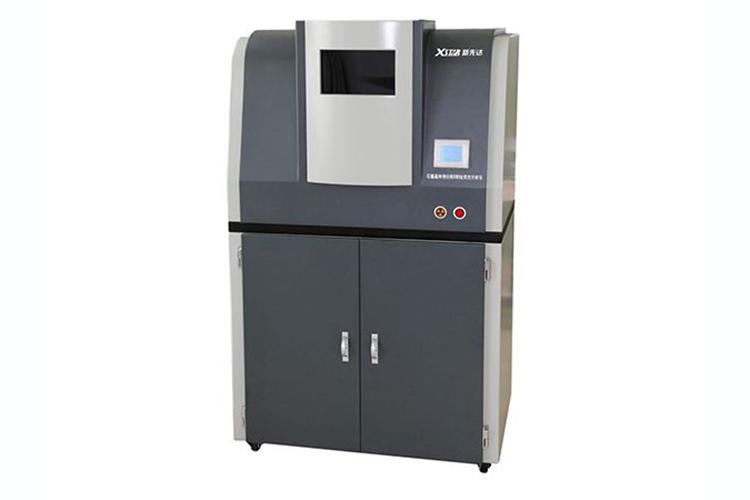
2. Instrument Composition
2.2.1 High-Voltage Power Supply: A device that provides high voltage and current to X-ray tubes and maintains the stability of both, consisting of a step-up transformer, high-voltage rectification and filtering, voltage and current adjustment, and related safety protection devices.
2.2.2 X-ray Tube: Composed of a filament cathode that emits hot electrons and a target anode that receives electrons. Under the influence of current, hot electrons are emitted, and under the high-voltage electric field between the diodes, these hot electrons fly rapidly towards the target anode, producing X-rays.
2.2.3 Detector: Converts X-ray fluorescence into voltage pulse signals. To accurately differentiate between X-ray fluorescence of different energies, a SDD semiconductor detector must be used to achieve energy resolution.
2.2.4 Amplifier: Voltage pulse signals are amplified to a certain multiple, divided into pre-amplifier and main amplifier. The pre-amplifier is generally designed within the detector, while the main amplifier is typically integrated on the same main board as the multi-channel analyzer.
2.2.5 Multi-Channel Analyzer: The multi-channel pulse amplitude analyzer is a crucial component in nuclear spectroscopy measurements, responsible for converting the measured analog quantities into digital values that computers can accept. Amplified voltage pulse signals enter the Analog-to-Digital Converter (ADC) and are stored in the analyzer's individual channels in digital form. Pulses with the same amplitude enter the same channel and are recorded.
2.2.6 Data Processing: Includes forming X-ray fluorescence spectrometry line shapes, identifying characteristic spectral peaks of various elements in the lines, energy calibration of the lines, calculating peak areas corresponding to target elements, real-time stabilization of line drift, establishing databases, analyzing samples, calculating concentrations, and printing reports.
3. Key Technologies
3.3.1 Multi-channel Analyzer Implements Various Output Modes: The pulse signals from the multi-channel analyzer are typically processed in a single-channel manner after being collected by the ADC, directly outputting spectrum data. This often leads to signal pile-up and track loss, reducing the instrument's resolution and pulse throughput. This analyzer collects the nuclear pulse signals through a high-speed ADC and processes them in three channels: one channel directly sends the raw pulses to the FPGA control unit; one channel outputs shaped pulses after pulse shaping; and the third channel outputs spectrum data after pulse shaping and amplitude analysis. Observations of the raw pulse signals and shaped waveforms can be used to dynamically adjust digital shaping parameters in real-time, avoiding the impact of signal pile-up and track loss on measurements, significantly improving the instrument's resolution and pulse throughput.
3.3.2 Digital Pulse Shaping via Pulse Signals: Digital pulse shaping is a key technology for nuclear instrument digitization and has become an active research area in nuclear signal processing in recent years. Currently, the voltage pulse signals from semiconductor detectors and charge-sensitive preamplifiers in nuclear instruments are no longer sufficient to meet the requirements of rapidly developing subsequent signal processing modules in terms of signal-to-noise ratio and energy resolution. Moreover, S-K filters based on discrete component design have many shortcomings in noise suppression, signal pile-up, spectral peak drift, and work stability. Additionally, true Gaussian pulse shaping has acausal components, making it difficult to achieve in analog systems. By using digital shaping technology to digitize the voltage pulse signals, these shortcomings can be overcome, and the overall performance of the measurement system can be improved. Additionally, this enhances the system's maintainability and versatility.
3.3.3 Pulse Amplitude and Width Discrimination in Multi-Channel Analyzers: Shape discrimination of pulse signals is essential for multi-channel analyzers. Traditional multi-channel analyzers can only perform amplitude discrimination on pulse shapes, but cannot discriminate the width of pulse shapes. While amplitude discrimination addresses the basic issues of nuclear measurement, it is inefficient due to the inability to solve issues like missed counts, dead time in measurements, and interference. The use of technology that simultaneously discriminates pulse amplitude and width eliminates spectral line interference peaks, increases the effective pulse counting, enhances work efficiency, and ensures the accuracy of measurement results.
4. Technical Specifications
Power supply for instrument: AC 220V
Analysis Element Range: K-U
Element content range: 0.2-10,000 mg/L
Utilizing imported U.S. SDD electrostatically conductive semiconductor detectors for counting, paired with dedicated digital pulse processing technology, the energy resolution exceeds 130eV (@5.9keV, shaping time 2μs).
Energy Range: 1-40 keV
Repetition: >65% >97% (N being the count rate)
High-pressure Tubular Light: 10kV-50kV
Tubular Current: 0-5mA
Tube rated power: 250W
※ System Energy Resolution: 130eV (@5.9keV, shaping time 2μs)
※ Inspection Time: 120S to 500S (time adjusted according to sample)
※ Measured Material State: Liquid
Calibration Method: Using standard sample calibration equipment.
Stable performance, reliable operation, high cost-performance ratio, and easy operation.
The detection limit is below 10-3 g/L.
Software controls high-voltage power supply, sets X-ray tube voltage and current, features over-voltage and over-current protection, X-ray tube temperature monitoring, and high-voltage power supply protection during idle time to extend tube lifespan.
※ Detection Limit: U: 0.25 μg/mL, Np: 0.3 μg/mL, Pu: 0.3 μg/mL
Precision: Concentration: U, Np, Pu measurement with RSD < 5% at 10μg/mL
Concentration Measurement Range: 2~10,000.25 μg/mL

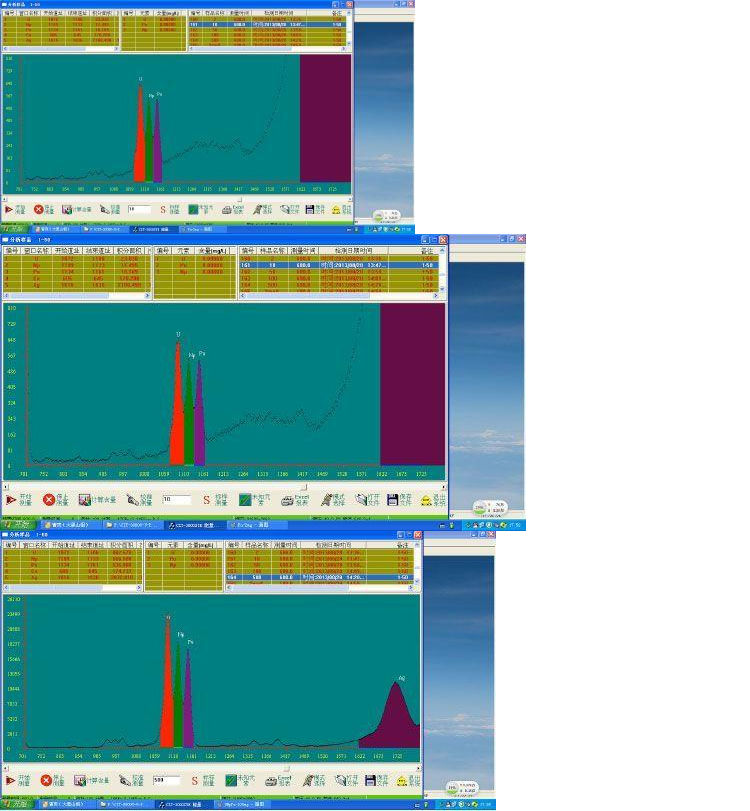
5 Spectral Measurements
6. Product Configuration List
1. Main controller: 1 unit
2. 1 light tube
3. One detector
4. 1 mainframe bracket
5. 1 High-pressure generator
6. 1 unit of water-cooled machine
7. Sample托 1 piece
8. 1 voltage stabilizer unit
9. 1 set of computers
10. 1 computer desk
11. Communication box 1 pc.
12. 1 set of software.
询价单


