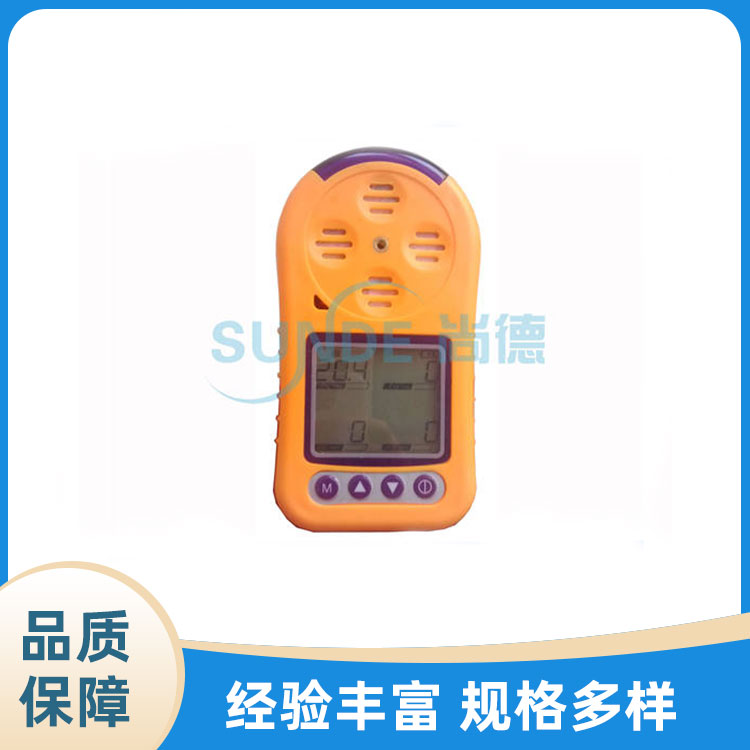


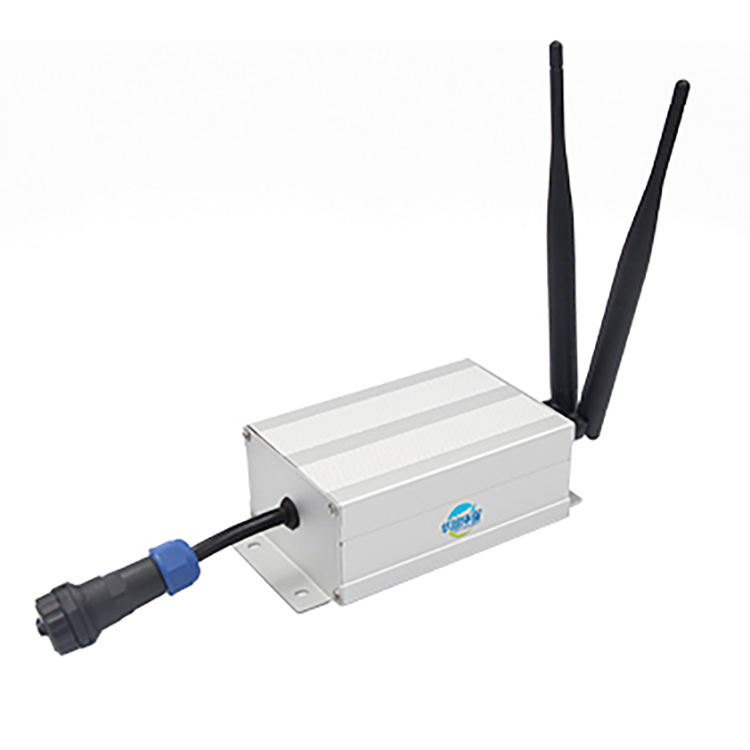

Weight: 700g
Dimensions: 220×145×60mm
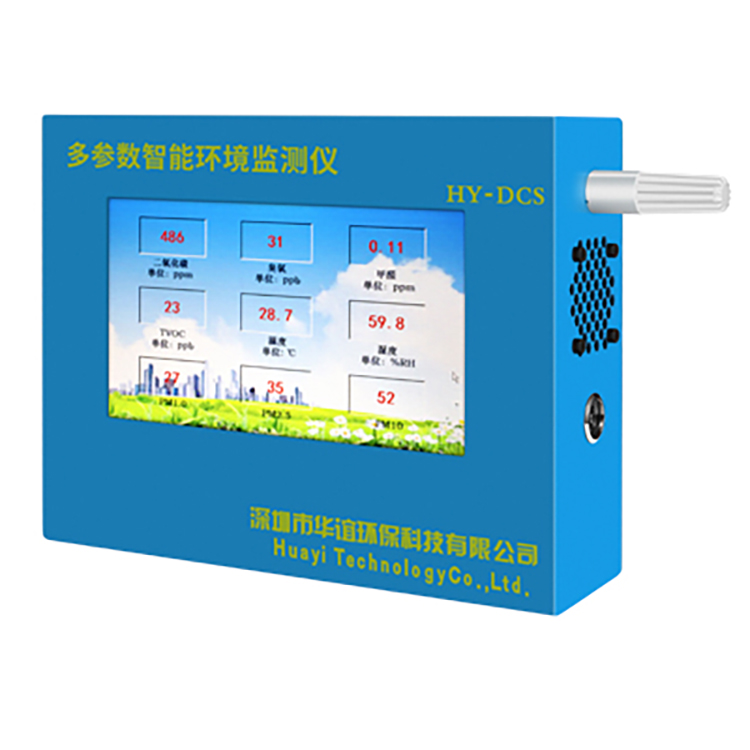
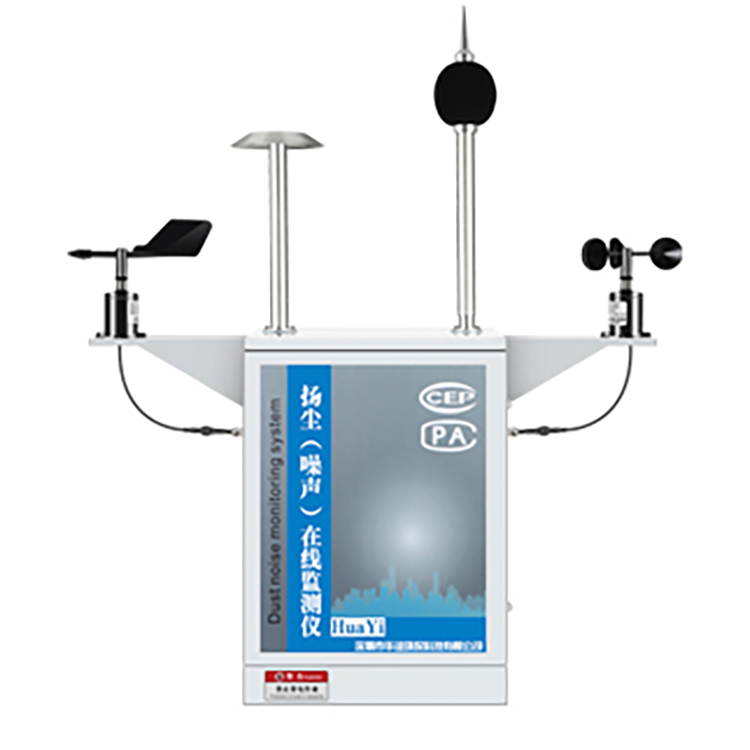
Sensor Types: PM2.5, PM10, Temperature, Humidity, GPS, NO2, SO2, CO, O3, VOC, NH3, CO2, etc.
Section 2: Working Hours: According to the standard power supply for drones
Data Transmission Method: GPRS / Data Transmission
Equipment lifespan: Gas components - 2 years, other components - 5 years
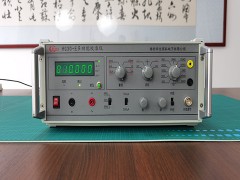
HY-WRJ(A6)Sensor Accuracy Test (Gas Sensor):
Test Environment: Enclosed Test Chamber
Standard Gas Concentration: 2.0ppm
Test Environment Temperature: 20℃
Relative Humidity: 40%
Sensor Quantity: 5 Units
Laying method: Horizontal row
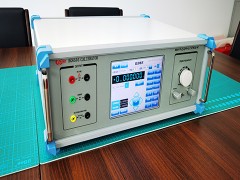
HY-WRJ(A6) Sensor Accuracy Test (Particle Sensor):
Test Environment: Enclosed Test Chamber
Particulate matter test concentration: 99.0 μg/m³
Test Environment Temperature: 22°C
Relative Humidity: 36%
Quantity of Sensors: 100 units
Placement: 4x25 array
Three: Working Environment Temperature: (-30-60)℃
Work Environment Humidity: (15-95)% RH, No Condensation
Equipment lifespan: Gas sensor - 2 years, other components - 5 years
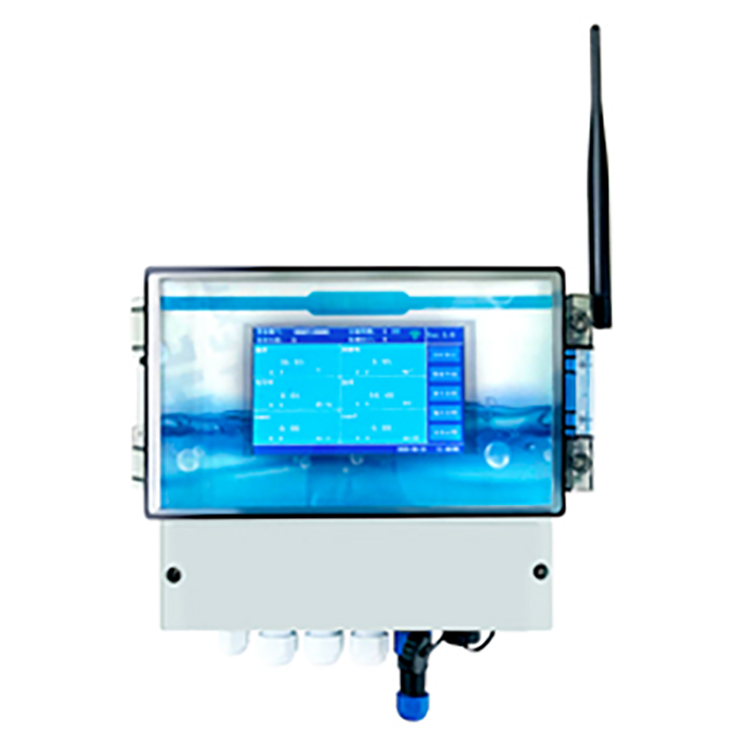
Data analysis platform, key features should include real-time data display, historical data query, regional pollution probability analysis, and pollution ranking statistics.
(1) Live Data Display
The platform can display various monitoring data in real-time. Air quality sensor data and conventional air automatic monitoring station data are integrated into a unified platform for centralized management and comprehensive presentation. Data from conventional stations and sensors are represented by different colors to indicate varying pollution levels.
(2) Historical Data Inquiry
Analyze historical monitoring data at various points through simple statistical methods, such as daily change analysis and time series analysis, to help buyers save time and costs associated with manual analysis, while also providing insights into the basic pollution conditions.
(3) Regional Pollution Probability Analysis
By calculating the cumulative probability of exceeding pollution standards in various regions over a period of time, we can identify areas with frequent pollution occurrences, which are the key areas for exceeding standards and may also be potential pollution sources. Managers can focus on regulating these areas based on the analysis results.
(4) Pollution Ranking Statistics
Real-time ranking analysis enables buyers to stay updated on the latest pollution trends, while historical ranking analysis assists buyers in identifying key pollution areas.