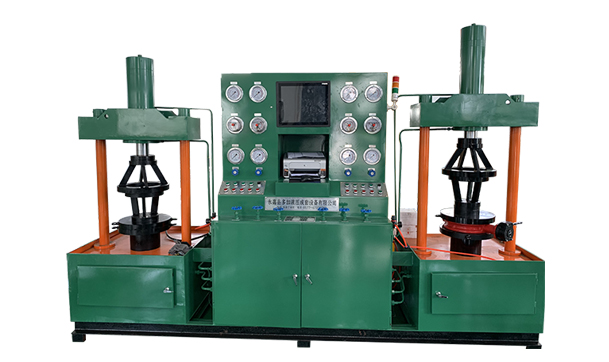


This system is based on the Windows 7 operating system, integrated with configuration software and PLCs to collect and process data during the testing process, and save it securely. Data is non-modifiable and non-deletable, ensuring its persuasive nature. Test data is automatically saved on the computer, allowing for real-time retrieval based on test number or time, with data extraction and printing capabilities. Below, we will specifically introduce the system's operational methods.
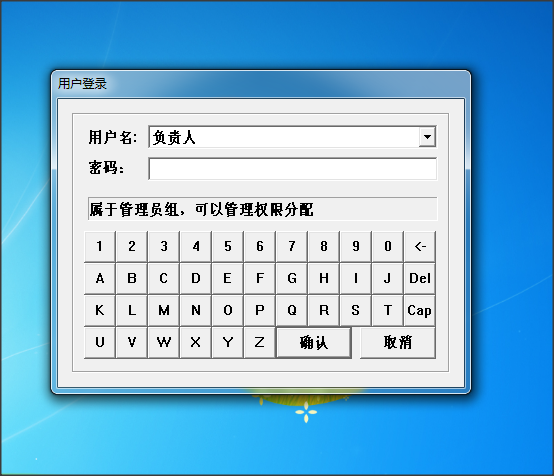
Double-click the icon after the computer boots up normally. A password input dialog box will pop up. Enter the password 935488, click "OK," and the data collection software will enter the running state.
2. Upon first entering, you'll land on the homepage window. The software includes operation instructions that can be referenced while performing specific actions.
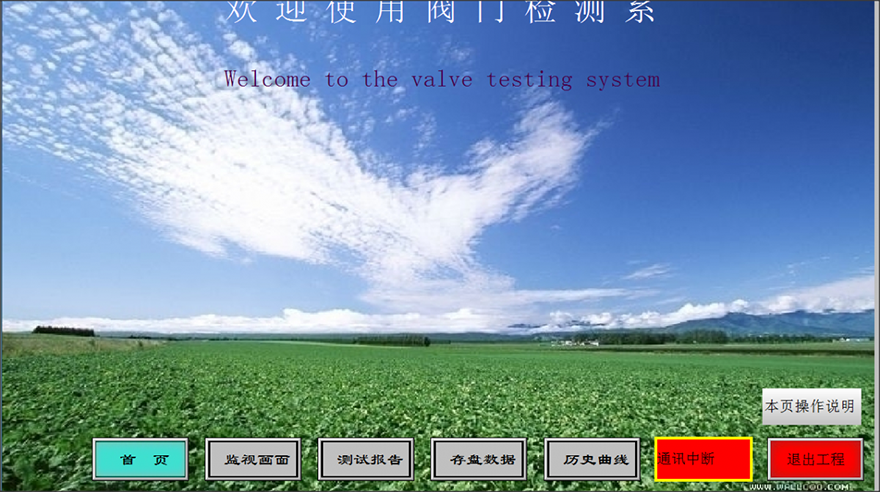
Click on the operation instructions on this page.

A blue border will be added to the button. Upon clicking any button, a popup will appear with the button's related function setup instructions.
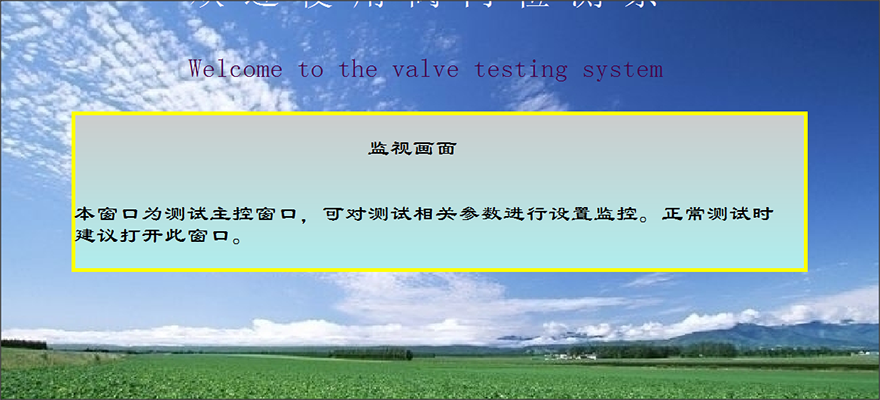
Click on another button, the previous explanation will automatically exit. Click "Exit," and you can leave the view of the operation instructions. At this point, you can switch windows and operate normally through the buttons. We proceed to the monitoring screen.
3. Preparations before testing, parameter settings.
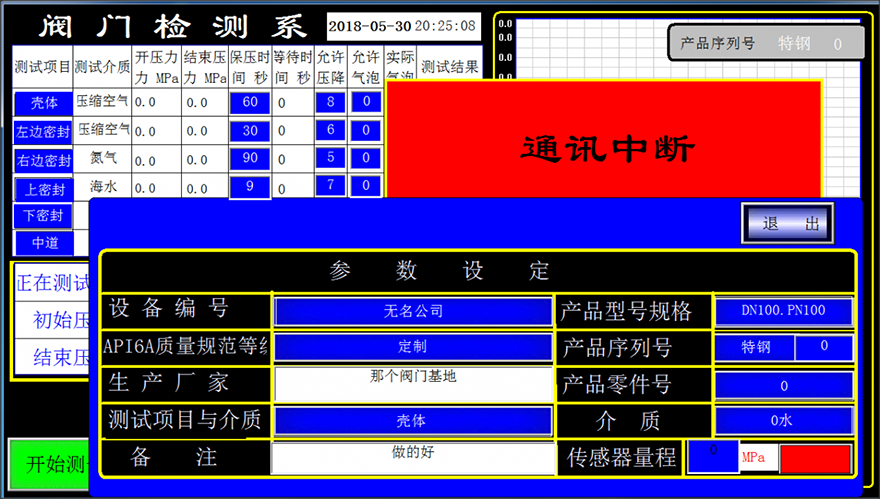
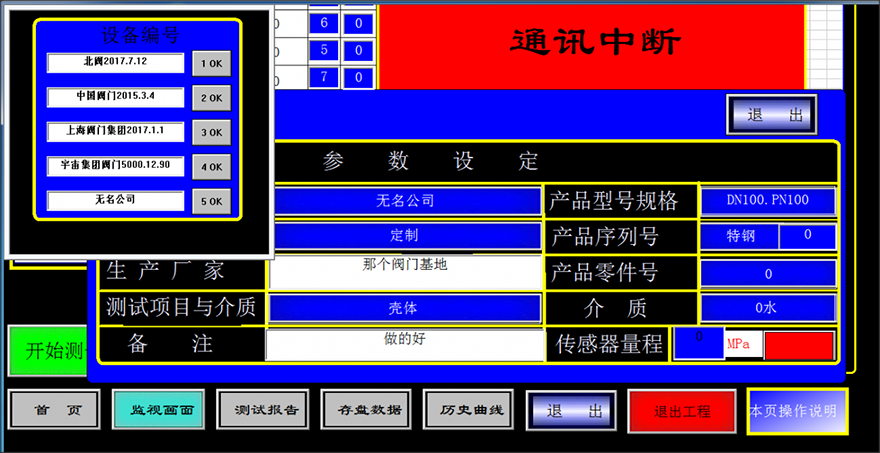
Upon entering the monitoring window, a parameter setup prompt will appear. We've pre-set some commonly used parameters for easy access in the future.
The blue section contains 5 preset groups that can be accessed at any time, while the white section allows for direct text input. This section is expected to be modified infrequently.
Be mindful that our bubble monitoring defaults to the first option. Also note that the icons differ.
Prior to initiating the test, we can zero-calibrate the sensor to minimize measurement errors. Select an appropriate range sensor based on the measurement requirements, and calibrate the sensor range.
Un calibrated, a prompt will appear. Once the relevant parameter settings are completed, you can proceed to the normal data collection test process.
Some key parameters are not set correctly; corresponding prompts will be displayed. Please check them during use.
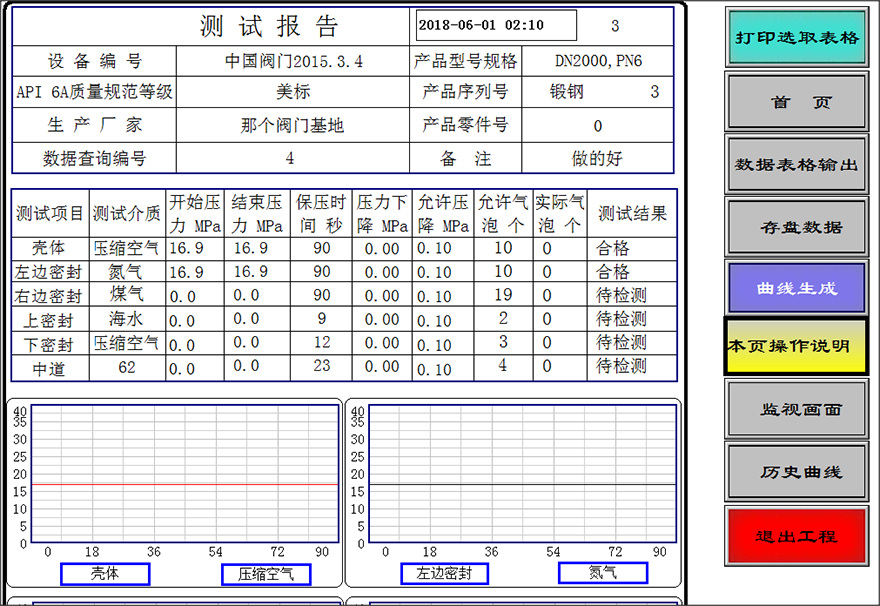
4. Data Testing and Collection
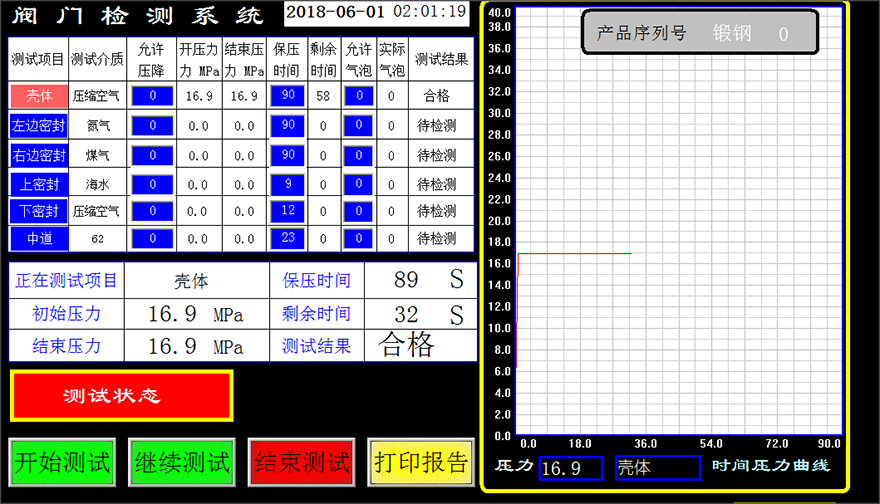
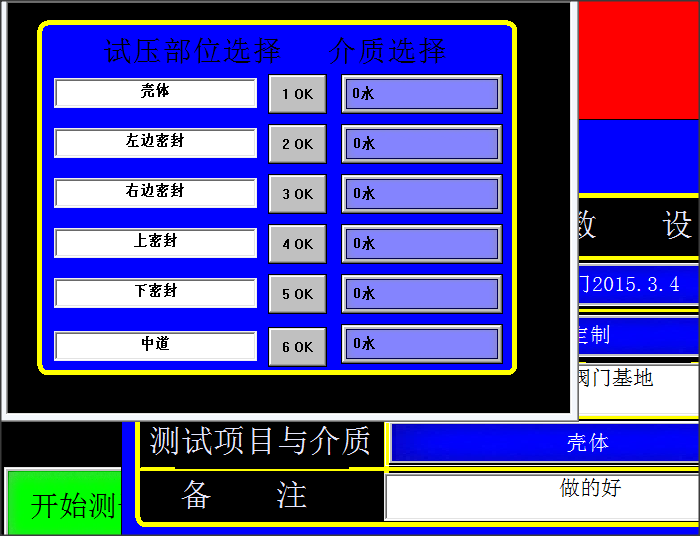
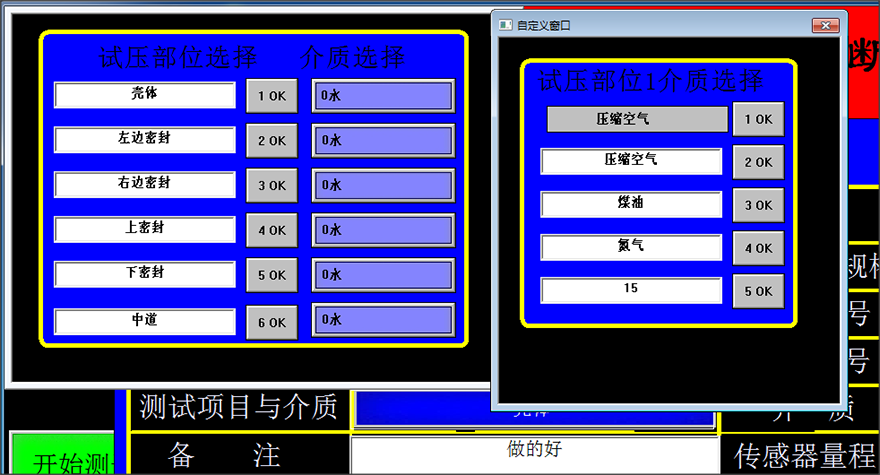
First, click the water and gas switch, select the corresponding water pressure or air pressure, click to start the test, then select the test items by clicking on the required test items with the mouse. The corresponding icon turns red, indicating it has been selected. Set the corresponding parameters, allow the pressure drop value, hold pressure time. The blue box in the image above is what needs to be set. Click to continue the test, the pump will automatically increase pressure, stop and hold pressure once it reaches the set pressure, and a pressure curve will appear in the right box. A straight line indicates no pressure drop, while a stepped decline shows where there are leaks.
During the test, if an anomaly is detected and the test needs to be terminated, click "End Test" to interrupt the valve test. If a valve part needs to be replaced, click "Continue Test." Please note, do not click "End Test" or "Print Report," as this will result in the test data of the same valve not being saved in the corresponding box for that valve. For specific details, refer to the operation instructions included within the software.
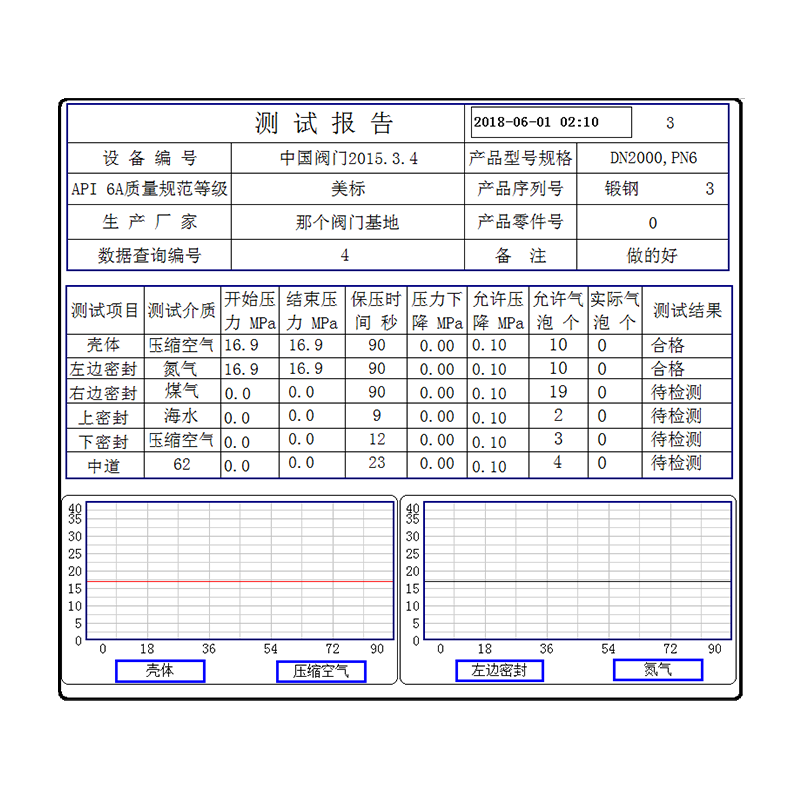
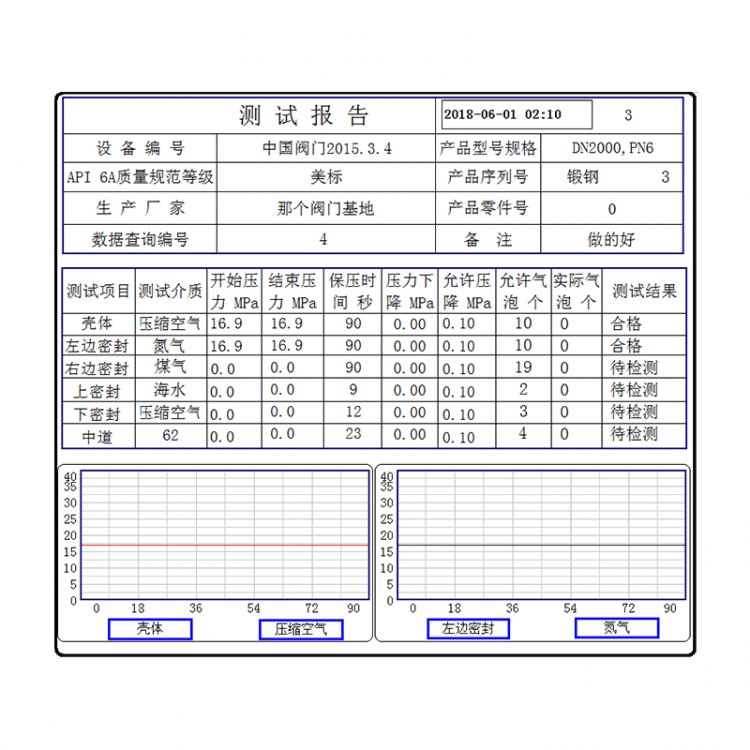
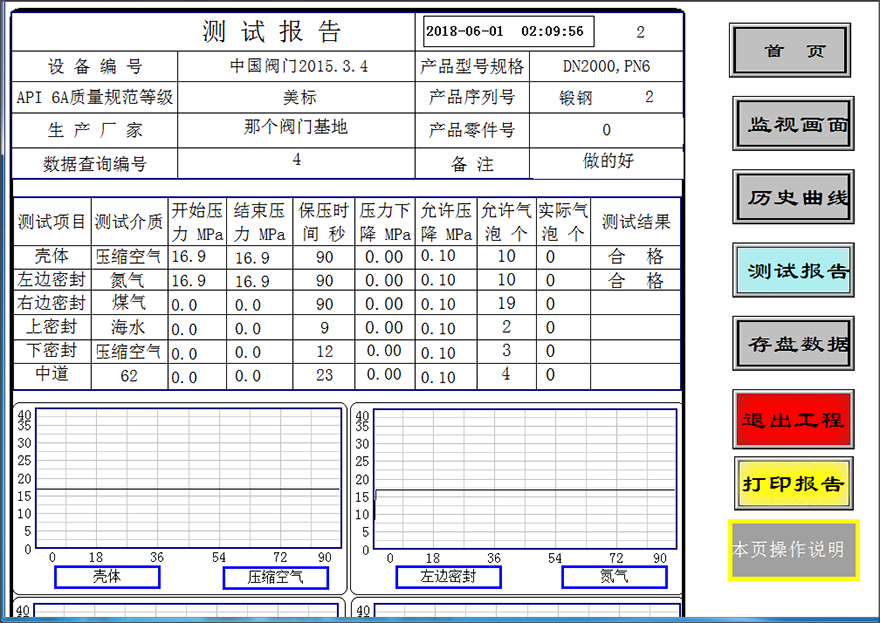
Table printing, after the test is completed, click on "Table Printing," and the printer will automatically print out the test data. Before printing, you can click on the "Test Report" to view the printout. After printing, the relevant data will also be saved into the system.
6. To retrieve stored data, access the stored data window when needed. Search the stored data using the query number on the test report or a specific test time, and extract the data to generate a table.
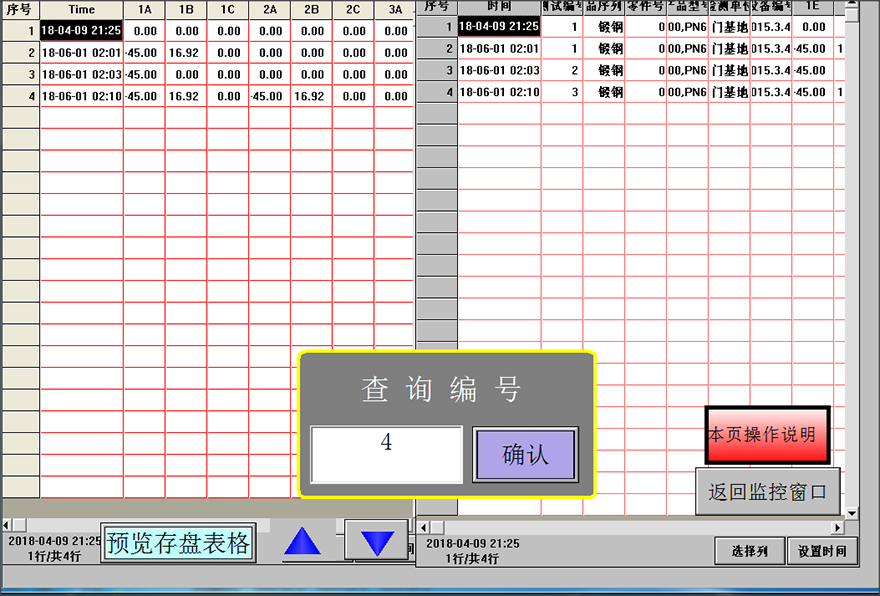
After data extraction, click the preview save table, the extracted data can be seen in the table.
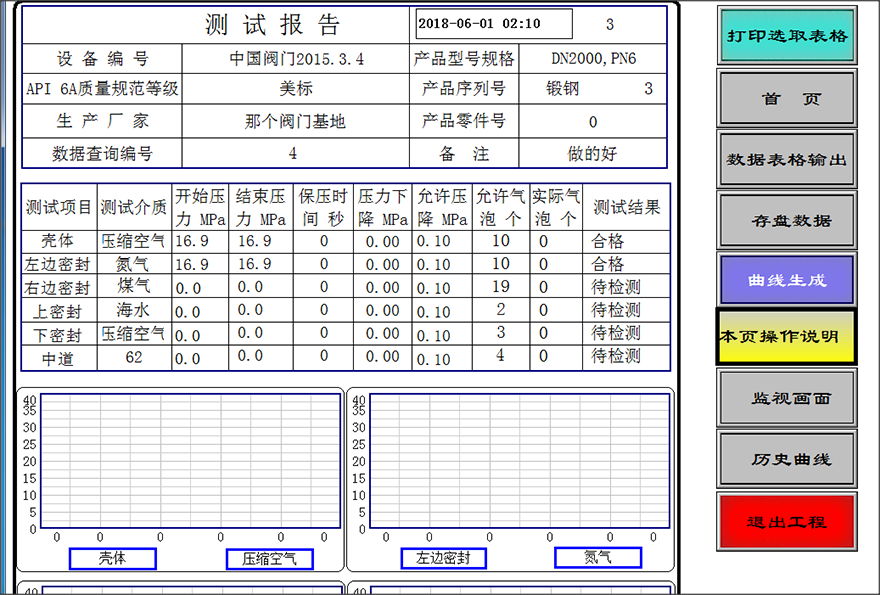
If a pressure curve during testing is required, click on "Curve Production," and the corresponding curve can be generated based on the saved data at that time.
7. Historical Curve Lookup: Real-time curves from past tests can also be viewed through the Historical Curve dialog box.
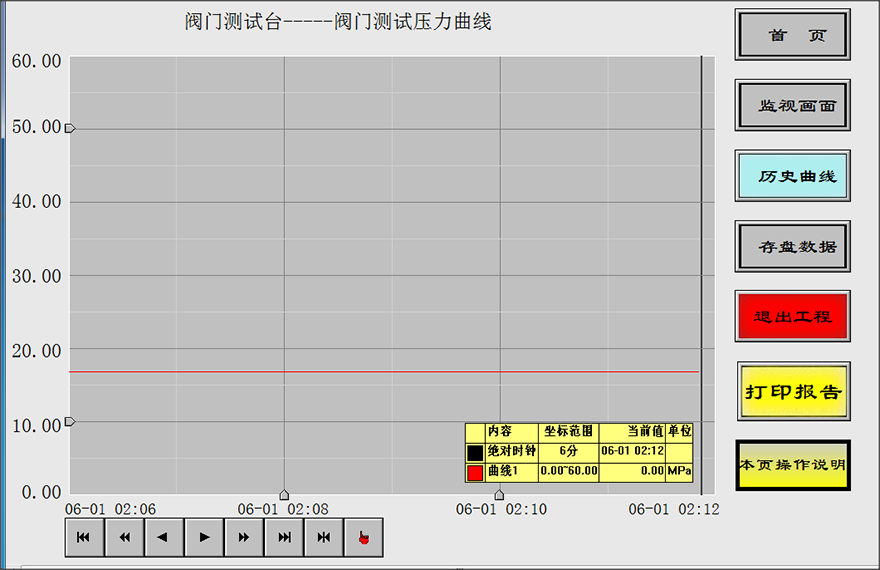
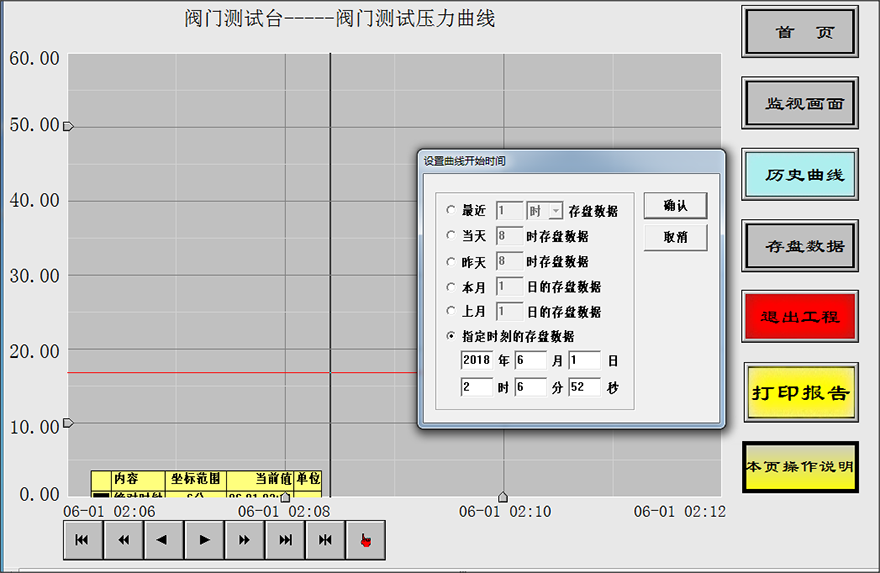
Click the red icon below to accurately search for pressure-time curves within a specific time period by date.
If you're unclear about using the software, refer to the internal operation instructions as much as possible.