


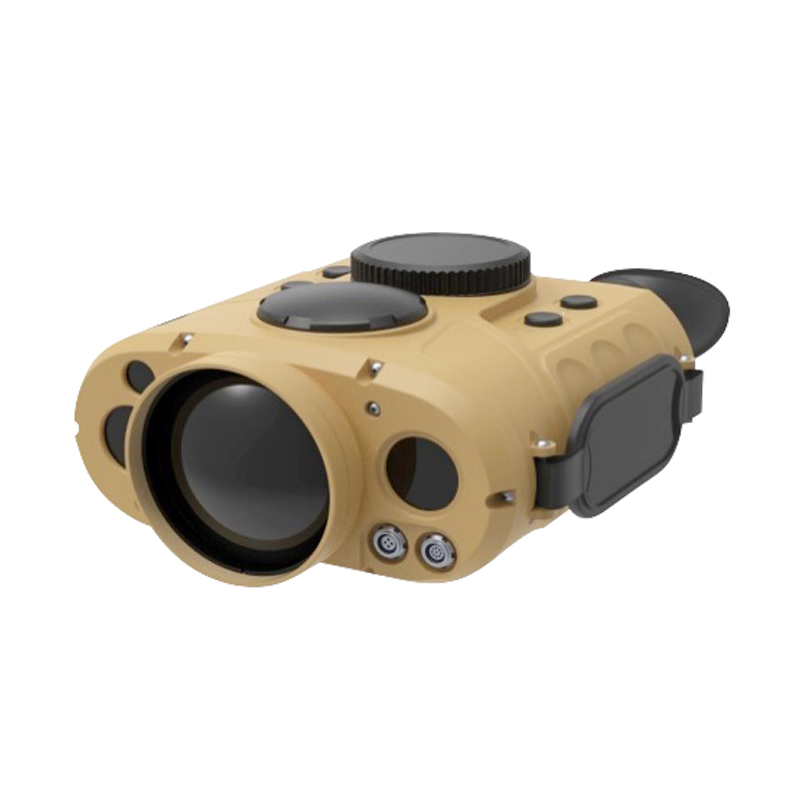
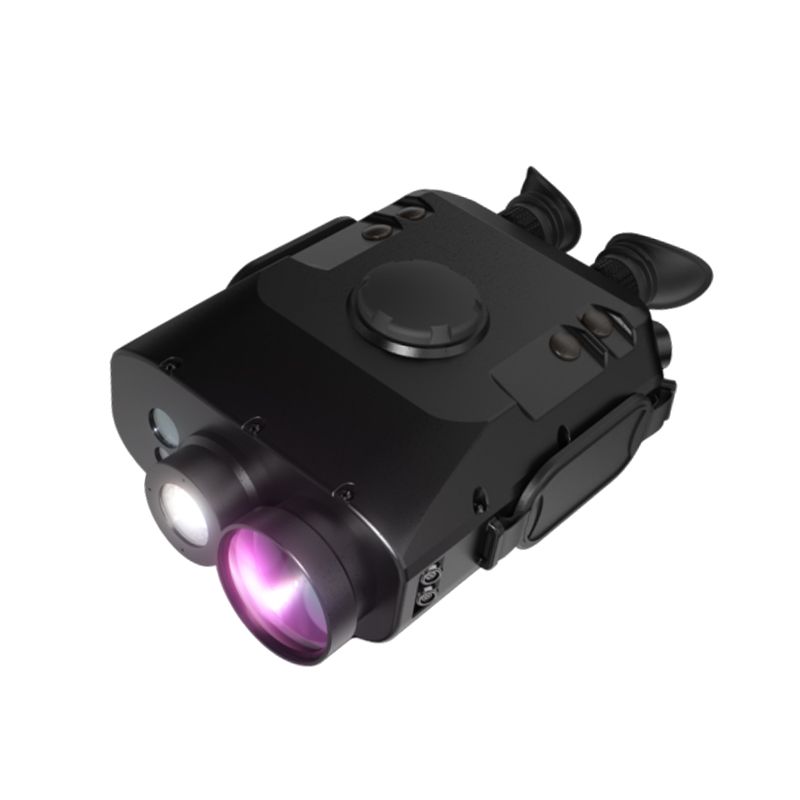


EDX-H500B XRF Spectrometer
Handheld X-ray Fluorescence Spectrometer H500 Series
Alloy/Ore/Soil Analysis
Simply the Best
One-click Test, Fast Non-destructive Inspection
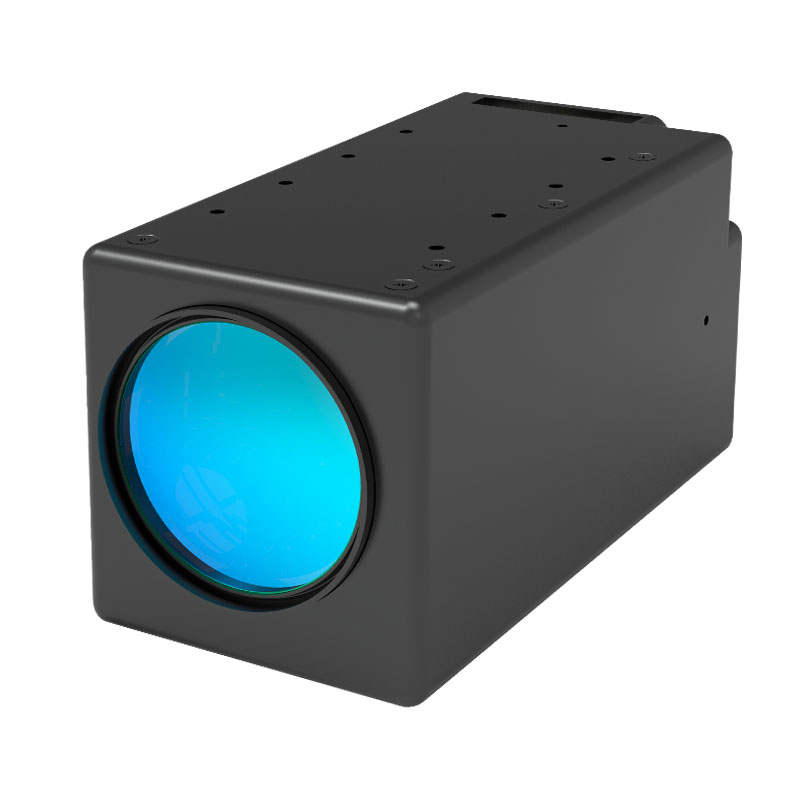
Lightweight, compact design with a pointed tip for tight spaces such as weld seams.
Performance, on-site non-destructive testing, allows direct contact with the surface of the sample to be tested, and on-site analysis of element content.
1/3 of the body is made of lightweight aluminum alloy, offering excellent radiation protection and heat dissipation.
> Quick startup in tens of seconds outperforms similar instruments, with fast testing speed and identity and grade verification in 2-3 seconds.
Durable construction, oversized color TFT screen display, no LCD altitude sickness, moisture and dust proof
Stable operating system, intelligent analysis software, quick response

New and fast metal element analysisNon-destructive TestingTechnology
Infocus(H500HandheldX-ray fluorescence spectrometer, it will revolutionize your material analysis approach.InfinesseSpectroscopic analyzers are used for metal recycling, identification of unknown materials, petrochemical and pipeline analysis, stainless steel mold steel, ore core and grade analysis, precious and special alloys, and other testing applications.
InfinesseThe spectrometer analyzer is compact, portable, and durable with its unique ergonomic design. With just a gentle press of a button, it can perform non-destructive elemental analysis, bidding farewell to costly and time-consuming laboratory testing, allowing you to truly experience...Convenience brought by the "P pocket lab."

Application Industry
Rapid, Non-Destructive Alloy Material IdentificationPMI)
Scrap Metal Classification and Verification
Alloy Grade Verification
Precious Metal Analysis: Gold Purity, GoldK-value, gold content in the alloy
Aerospace AlloysQA/QC
RoHS and WEEE Hazardous Substance Analysis
Mining and exploration
Soil, clay, and sediments
Environmental Monitoring
Waste Sorting
Lead in Paint
Automotive Catalyst (Three-Way Catalyst)
Coating Thickness
Archaeology Law
Dental Alloy Composition
InstrumentFeatures
Result
With robust hardware and unique software algorithms,H500 offers high elemental analysis accuracy and precision for various materials.
Rapid analysis
Infinesense's Dynamic Adaptive Forming DPP digital multi-channel analysis technology enables the H500 portable XRF analyzer to complete tests at a faster rate.
Long-term stability
Thanks to high-power digitalX-ray source, automatic temperature and pressure correction, plus digital calibration adjustment, the H500 offers long-lasting analysis reproducibility without the need for recalibration.


 Technical Specifications
Weight | Main Unit: 1 . 35 kgWith battery installed: 1 . 49 kg | |
Dimensions | 235 mm x 82 mm x 260 mmDimensions: (Length, Width, Height) | |
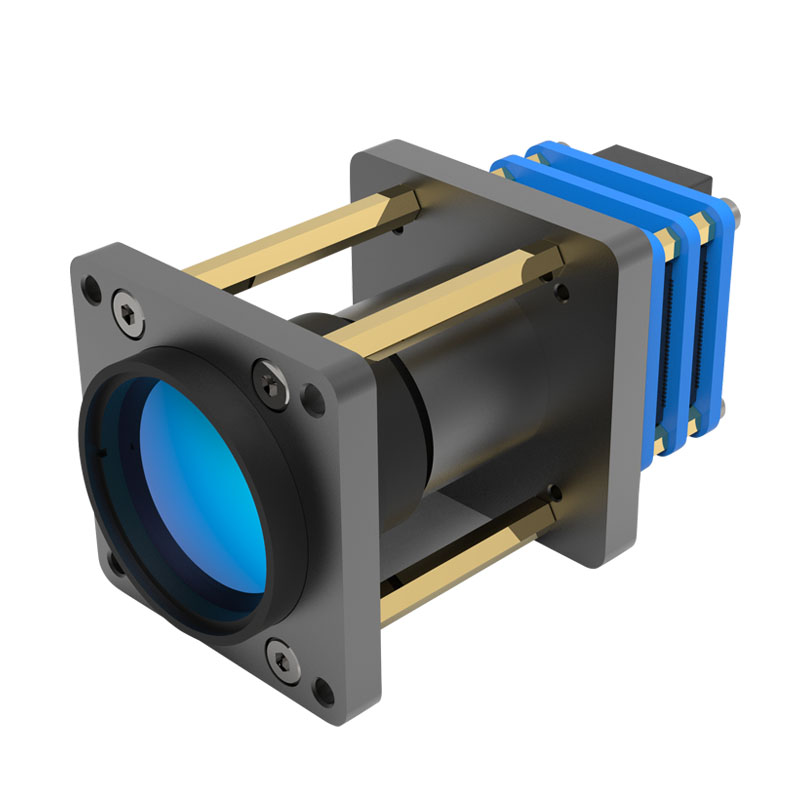
Source of Inspiration | High-power high-performance miniXRay Tube | |
Target Material | Rhodium(Rh)Silver(Ag)Tungsten(W)Optional | |
Voltage | H500A 35 kv | H500B 50 kvVoltage( Voltage availableAdjust) |
FilterFilm Sheet | A variety of selectable filters Automatically adjusts to different test objects | |
Detector | H500A Si- Pin | H500B SDD |
Cooling System | Peltier Effect Semiconductor Refrigeration System | |
Standard Sheet | Alloy Calibration Sheets | |
Power Supply | Standard Configuration2Block lithium battery( Single piece6800 m Ah) | |
Processor | High-performance pulse processor | |
Operating System | Windows CESystem( Version) | |
Data Transmission | USBBluetoothWi Fi Hotspot Sharing Feature | |
Software Standard Mode | Spectrometer Element Analysis SoftwareV1.0 | |
Data Processing | SD Massive storage cards Can store tens of thousands of data records( Memory expandable) | |
Display Screen | High-resolutionTFTIndustrial-grade full-color high-definition touch screen Ergonomic design Durable, dustproof, waterproof.Clearly visible under any light condition | |
Safe Operation | One-touch detection, with software features for automatic timing lock and automatic test stop; to determine when there are no samples in front of the test window.2 secondsSelf-closing insideXRay( Anti-stupid function) | |
Intelligent System | Intelligent atmospheric pressure recognition and calibration | |
Calibrate | The instrument has been calibrated before shipment. The instrument features the capability to establish targeted calibration curves. Tailored for specific samplesA confirmed test | |
Result Report | Instrument comes with standardUSBBluetoothWi Fi Hotspot sharing transmission feature Custom report formats are available upon request.EXCELGratePlease download and check the data.XSpectrum diagram( Users can customize reports based on application needs.) | |
Analysis elements | Mg、Al、Si、P、S、Ti、V、Cr、Mn、Fe、Co、Ni、Cu、Zn、W、Hf、Ta、Re、Pb、Bi、Zr、Nb、Mo、Ag、Sn、Sb、Pd、Cd TiAndThWaiting elements | |
Protective Device | High-grade, high-intensity, triple protection box The instrument comes with a built-in test window cover. Prevent accidental damage | |
Accessories | Standard Configuration5Sheet test window protective film Original factory power adapters and charging devices | |
Attachment | Instrument Operation Manual Factory Inspection Report | |
Stainless Steel316 Continuous Test Analysis Report
Instrument model:H-500AHandheld Spectrometer | Sample: | Stainless Steel 316 | ||||||
Test Time: | 30 Second | |||||||
No. of Reading | Calibration Curve | Cr % | Mn % | Fe % | Ni % | Cu % | Mo % | |
1 | High Alloy steel | 16.648 | 0.878 | 69.346 | 10.121 | 0.309 | 1.987 | |
2 | High Alloy steel | 16.688 | 0.849 | 69.356 | 10.100 | 0.325 | 1.983 | |
3 | High Alloy steel | 16.642 | 0.872 | 69.435 | 10.061 | 0.315 | 1.991 | |
4 | High Alloy steel | 16.679 | 0.918 | 69.276 | 10.102 | 0.311 | 1.975 | |
5 | High Alloy steel | 16.611 | 0.899 | 69.266 | 10.196 | 0.305 | 1.984 | |
6 | High Alloy steel | 16.652 | 0.888 | 69.422 | 10.021 | 0.304 | 1.996 | |
7 | High Alloy steel | 16.722 | 0.865 | 69.305 | 10.098 | 0.318 | 1.975 | |
8 | High Alloy steel | 16.702 | 0.836 | 69.438 | 10.037 | 0.313 | 1.988 | |
9 | High Alloy steel | 16.629 | 0.876 | 69.382 | 10.076 | 0.312 | 1.963 | |
10 | High Alloy steel | 16.642 | 0.864 | 69.388 | 10.117 | 0.302 | 1.974 | |
Ranges | 0.111 | 0.082 | 0.172 | 0.175 | 0.023 | 0.032 | ||
AverageAverage | 16.662 | 0.874 | 69.361 | 10.093 | 0.311 | 1.982 | ||
Standard Deviation SnStandard Deviation | 0.0349 | 0.0236 | 0.0633 | 0.0492 | 0.0071 | 0.0096 | ||
RSDRelative Standard Deviation | 0.209% | 2.694% | 0.091% | 0.488% | 2.276% | 0.486% | ||
Tin Ore Continuous Testing Analysis Report
Instrument model:H-500AHandheld spectrometer | Sample: | |||||
Test Time: | 30 Second | Unit: % | ||||
No. of Reading | Calibration Curve | Sn | Cu | Fe | Mo | |
1 | Mineral | 49.3554 | 5.7654 | 56.0551 | 5.4208 | |
2 | Mineral | 50.6876 | 5.6713 | 55.9913 | 5.5935 | |
3 | Mineral | 50.3881 | 5.7493 | 56.0739 | 5.3518 | |
4 | Mineral | 49.8010 | 5.7727 | 56.1811 | 5.4086 | |
5 | Mineral | 49.8032 | 5.6791 | 55.8322 | 5.3257 | |
6 | Mineral | 49.9043 | 5.7250 | 56.0807 | 5.4958 | |
7 | Mineral | 50.5025 | 5.6975 | 55.7652 | 5.4550 | |
8 | Mineral | 48.4144 | 5.7198 | 55.7945 | 5.4728 | |
9 | Mineral | 50.4025 | 5.7634 | 56.0962 | 5.4033 | |
10 | Mineral | 49.5978 | 5.7385 | 56.3685 | 5.4228 | |
AverageAverage | 49.886 | 5.728 | 56.024 | 5.435 | ||
Standard Deviation SnStandard Deviation | 0.6738 | 0.0362 | 0.1864 | 0.0757 | ||
RSDRelative Standard Deviation | 1.351% | 0.633% | 0.333% | 1.393% | ||
Continuous Soil Heavy Metal Test Analysis Report
Instrument Model : | H-500BHandheld spectrometer | |||||||||
Unit: PPM | Test Time: 60Second | Test Sample:Soil Standard Sample | ||||||||
No.of | Calibration | V | Cr | Co | Ni | Cu | Zn | As | Pb | Cd |
1 | Soil | 96.2 | 64.6 | 16.0 | 20.5 | 26.0 | 695.1 | 54.3 | 116.3 | 5.0 |
2 | Soil | 96.0 | 67.5 | 16.3 | 25.4 | 28.1 | 688.8 | 52.1 | 118.4 | 4.4 |
3 | Soil | 99.0 | 69.3 | 16.3 | 23.6 | 29.2 | 683.7 | 55.5 | 116.7 | 4.9 |
4 | Soil | 96.1 | 63.6 | 16.4 | 21.7 | 28.1 | 692.1 | 54.5 | 119.1 | 4.7 |
5 | Soil | 98.6 | 66.4 | 16.3 | 28.0 | 25.2 | 689.8 | 51.5 | 118.8 | 4.5 |
6 | Soil | 93.8 | 66.1 | 16.3 | 29.0 | 22.5 | 683.6 | 55.1 | 117.4 | 3.7 |
7 | Soil | 96.0 | 70.4 | 16.7 | 23.7 | 30.5 | 692.5 | 56.6 | 120.0 | 4.4 |
8 | Soil | 97.7 | 63.5 | 16.5 | 27.3 | 26.0 | 685.9 | 52.5 | 116.4 | 3.9 |
9 | Soil | 97.4 | 65.9 | 16.6 | 24.9 | 31.3 | 697.7 | 54.3 | 118.7 | 3.4 |
10 | Soil | 99.8 | 74.4 | 16.6 | 22.1 | 26.6 | 686.8 | 55.3 | 118.2 | 3.6 |
11 | Soil | 97.3 | 66.9 | 16.5 | 22.0 | 26.5 | 682.2 | 56.4 | 116.9 | 5.7 |
Real Value of Sample Standard Value | 96.0 | 62.0 | 14.2 | 20.4 | 21.0 | 680.0 | 55.5 | 109.0 | 4.3 | |
Average Test Average | 97.1 | 67.2 | 16.4 | 24.4 | 27.3 | 688.9 | 54.4 | 117.9 | 4.4 | |
Standard Deviation-Sn Standard Deviation | 1.61 | 3.07 | 0.18 | 2.67 | 2.39 | 4.79 | 1.62 | 1.18 | 0.64 | |
RSD Relative Standard Deviation | 1.655% | 4.567% | 1.082% | 10.961% | 8.754% | 0.695% | 2.972% | 0.997% | 14.655% | |