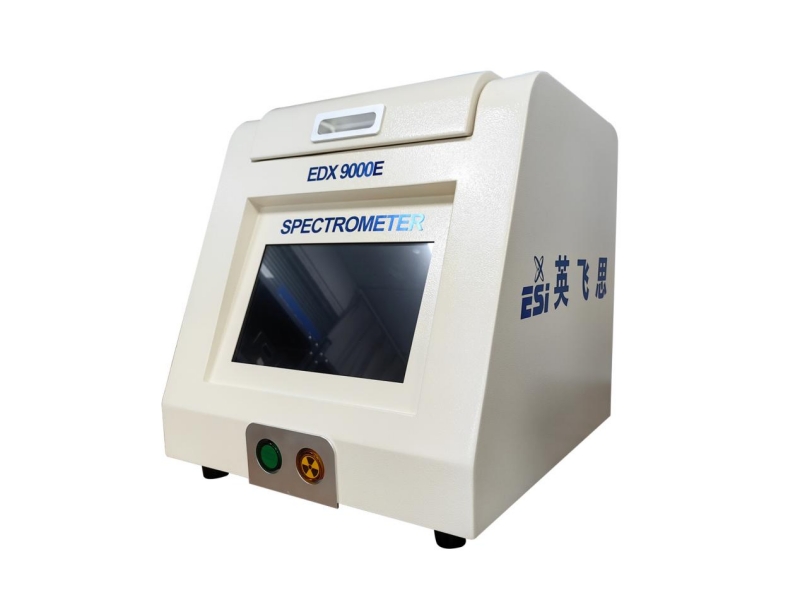


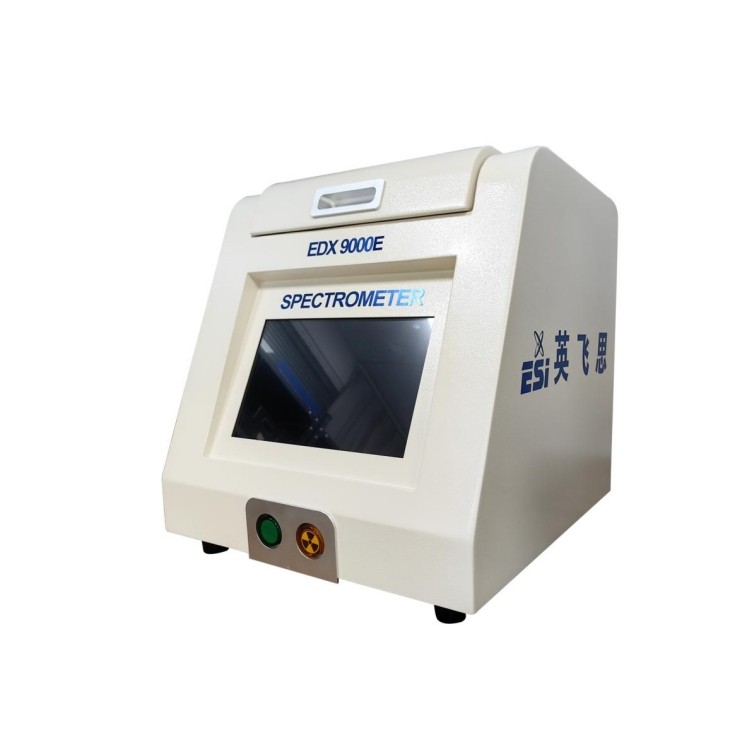


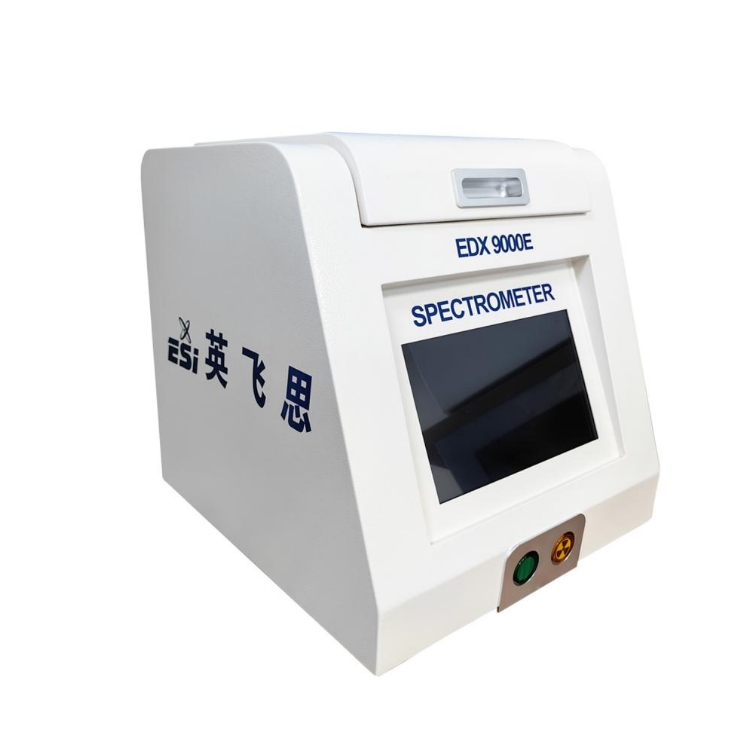
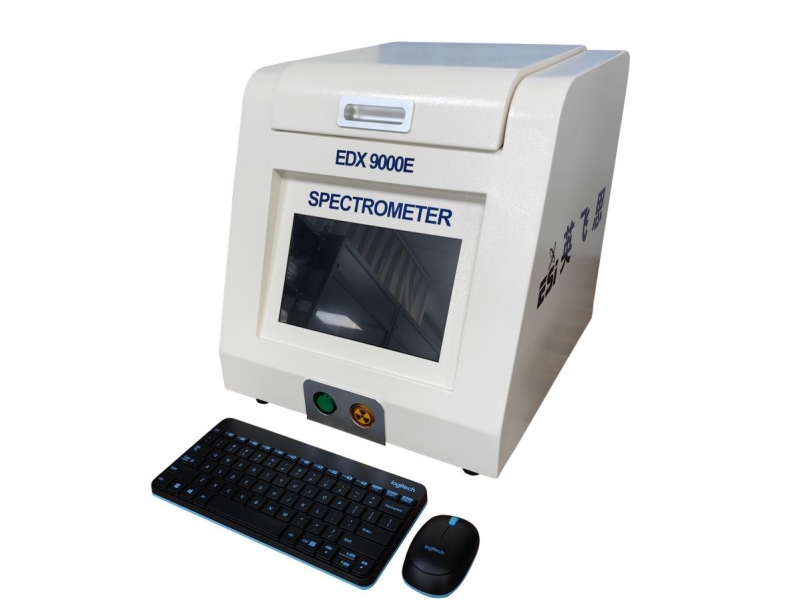
High-Precision X-Ray Fluorescence Oil Analyzer
Rapidly analyze the total sulfur content in oil products
Expandable analysis of wear metal content in lubricating oils
Fast analysis speed, no complex sample pretreatment required
Minimal human error, pollution-free
Software and Data Management
Meets Standards:
GB/T 17040,GB 17411
ISO 13032, ISO 20847, ISO 8754, ASTM D4294, ASTM D4929, JIS K2541-4, IP 336 and IP 496 ASTMD7751,ASTM D6481,ASTM D5059
Overview
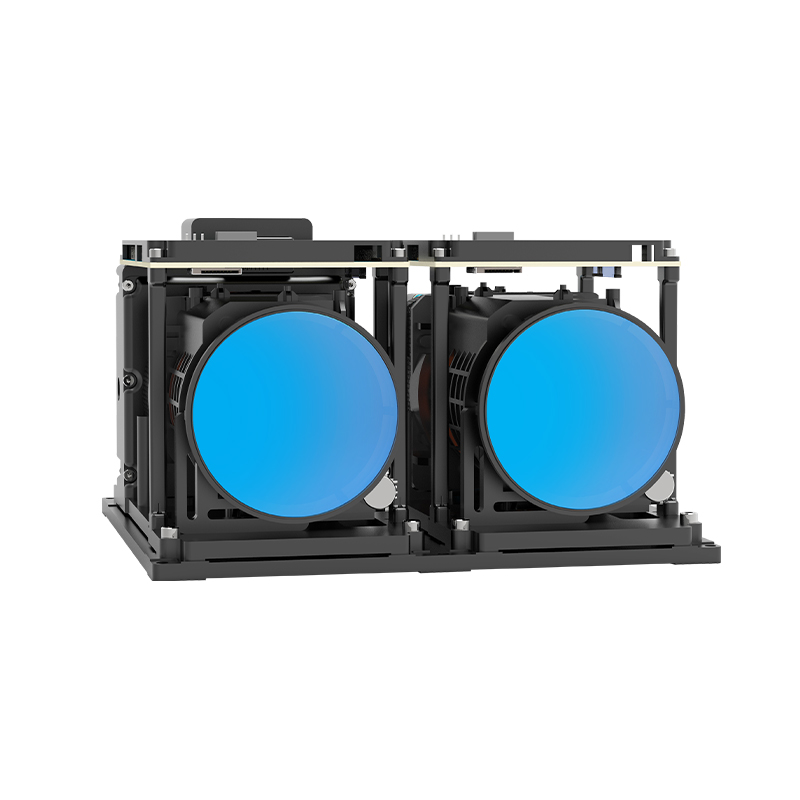
X-ray Fluorescence Spectrometer (XRF Spectrometer, abbreviated as XRF) is a rapid, non-destructive method for material measurement. It works by using an X-ray excitation source to illuminate the oil sample to be analyzed. When the inner electrons of the sulfur element in the sample are ejected, causing a transition of the electrons outside the nucleus, the excited electrons emit characteristic X-rays when they return to their ground state. The detector captures these characteristic X-ray signals from the sulfur element, and the instrument's software system converts them into corresponding test intensities. A calibration curve is established by using standard material samples to relate the characteristic X-ray intensity to the sulfur content. After establishing calibration curves for different sulfur content ranges, testing unknown samples can quickly analyze sulfur content in petroleum and other liquids.TotalSulfurAnd other elementsContent。
The advanced performance of the EDX9000E can also be extended to more applications, including:
Lubricating oilChineseWorn metalElemental ContentAnalysis, to comply ASTM D7751/ASTM D6481/ASTM D5059Standard
MeasureTotal oil contentChlorineContentTo achieve desalination and corrosion control
Determine LowContentThe S, Ni, V, Ca, and Fe are added to extend the catalyst's lifespan and enhance its performance, and the sulfur content in the fuel production and blending process is analyzed.
Features and Advantages
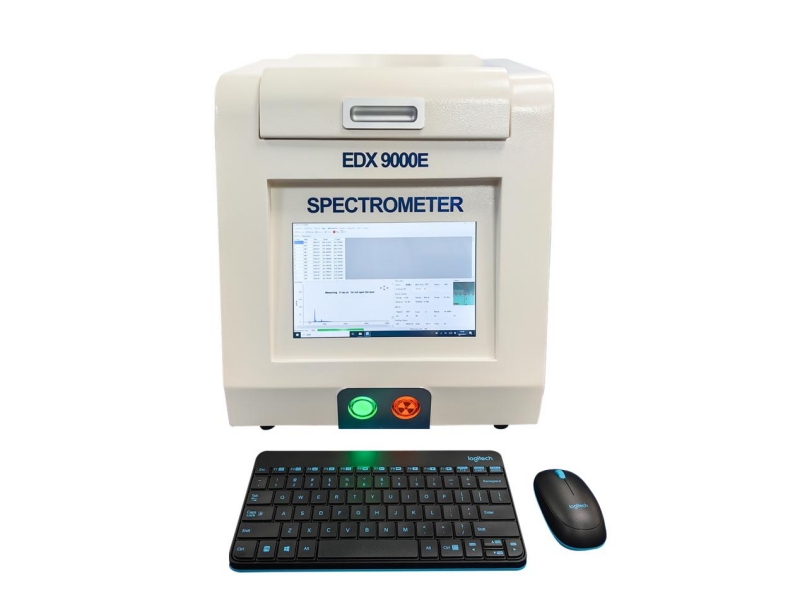
1. Fast, a sample typically yields the sulfur content in just 100 seconds.
2. Accurate, test results can achieve laboratory-grade precision
3. Seamless,The X-ray fluorescence sulfur analyzer is a non-destructive analysis method. It is completely harmless to the sample.
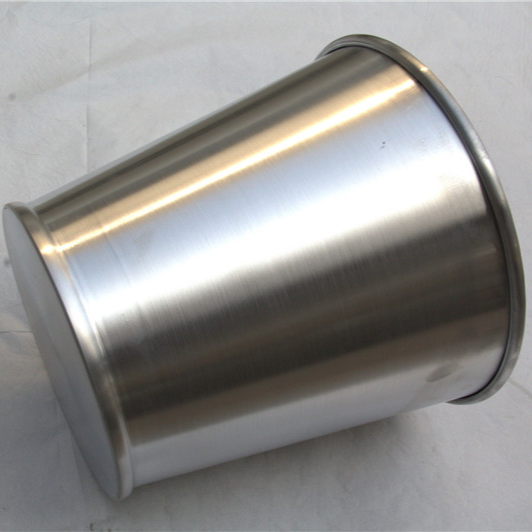
4. Sample preparation is simple; just place the sample in a 5ml dedicated sample cup for machine testing.
5. Low cost of use and maintenance, no need for inert gas consumption
6. Simple operation, quick to master, no need for daily recalibration, significantly enhancing testing efficiency
7. Wide linear dynamic range, capable of analyzing from 1 mg/L to5Sulfur content: 0.000 mg/L
8. Unaffected by the matrix of the sample, X-ray fluorescence spectrometry is unrelated to the chemical bonding state of the sample and is also largely independent of the state of materials such as solids, powders, liquids, crystalline, and amorphous.
9. Long-term stability and high test accuracy
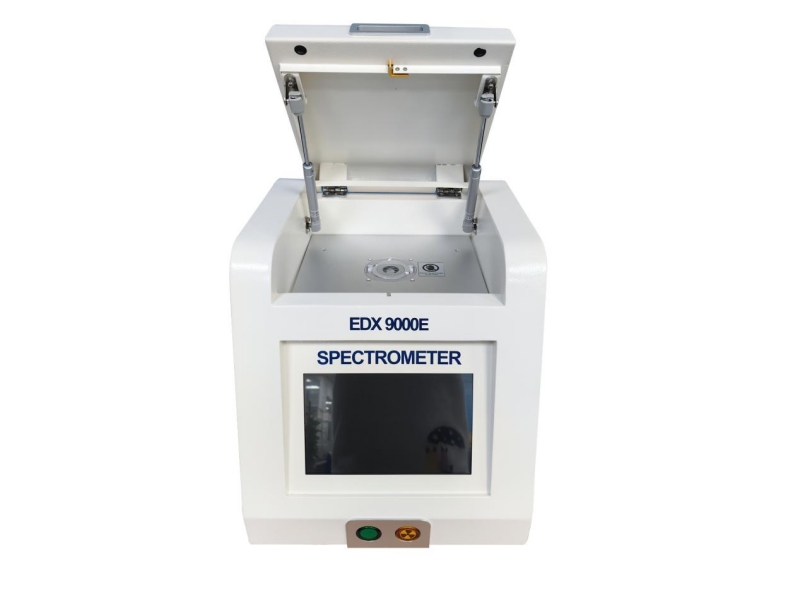
Instrument specifications
Instrument dimensions: 380mm×372mm×362mm |
Sample cavity size:310mm*280mm*60mm |
Instrument weight: 30Kg |
Element Range:Mg Magnesium 12-U Uranium 92 |
Factory calibration curves include: Low sulfur:10ppm- 100ppm High Sulfur0.01%-5% Metal Element Analysis of Expandable Lubricant |
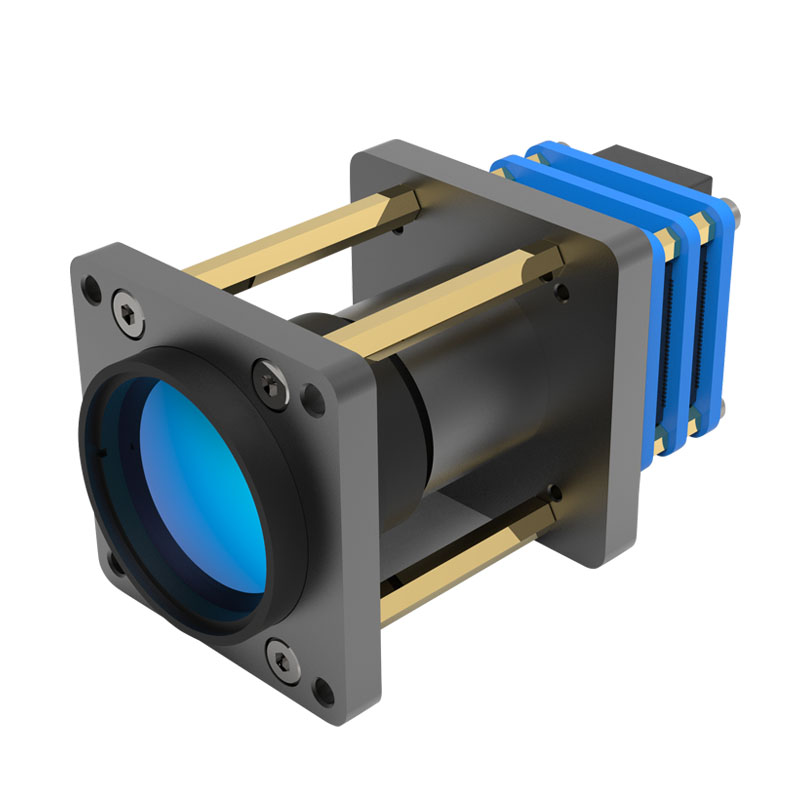
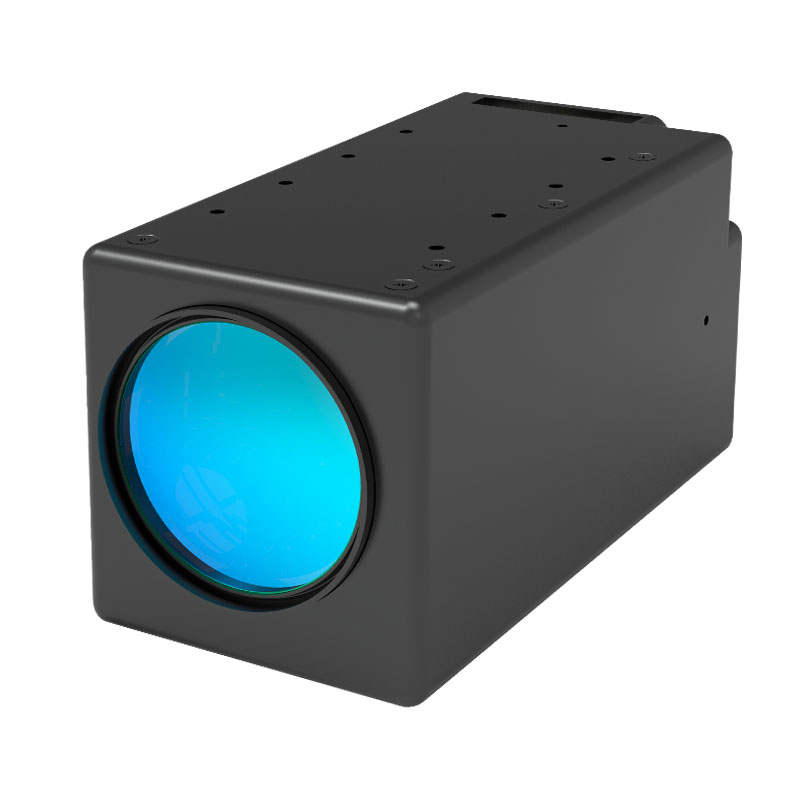
Detector: Original Imported High-Resolution Electro-Cooled DetectorSDD, Upgradable to FSDD |
Multi-Analyzer: 4096-channel DPP analyzer |
X-ray Tube: 50W High-Power Silver/Rhodium Target Beryllium Window Tube |
Voltage:220ACV 50/60HZ |
Ambient Temperature:-10°C to 35°C |
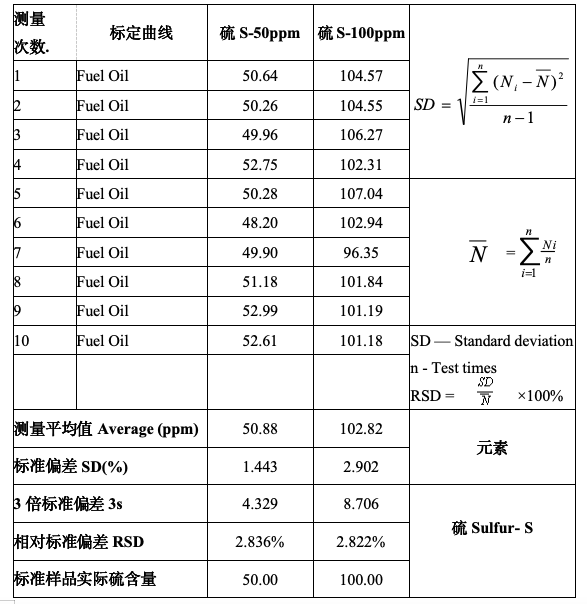
Precision Test Report
Standard Sample of Sulfur Content in Gasoline10 consecutive test reports
Lubricant Standard Sample5 consecutive test reports
Standard Sample Content Unit: | PPM | Measurement Time: 60 seconds | ||||||||
No. Number of Measurements | Calibration Curve | Calcium | Titanium | Vanadium | Chrome (Cr) | Mn Manganese | Fe iron | Nickel | ||
1 | Lubricant | 318 | 304 | 300 | 307 | 308 | 309 | 308 | ||
2 | Lubricant | 278 | 305 | 294 | 299 | 305 | 303 | 298 | ||
3 | Lubricant | 323 | 302 | 300 | 313 | 303 | 306 | 303 | ||
4 | Lubricant | 279 | 309 | 300 | 304 | 305 | 305 | 299 | ||
5 | Lubricant | 318 | 310 | 300 | 304 | 306 | 305 | 306 | ||
Standard Sample Content | 300 | 300 | 300 | 300 | 300 | 300 | 300 | |||
Test Average | 303.2 | 306 | 298.8 | 305.4 | 305.4 | 305.6 | 302.8 | |||
Test Standard DeviationSn | 22.643 | 3.3912 | 2.6833 | 5.1284 | 1.8166 | 2.1909 | 4.3243 | |||
Toleranceppm | 3.2 | 6 | -1.2 | 5.4 | 5.4 | 5.6 | 2.8 | |||
Test Relative Standard Deviation | 7.47% | 1.11% | 0.90% | 1.68% | 0.59% | 0.72% | 1.43% | |||
No. Number of Measurements | Calibration Curve | Copper | Zn Zinc | Molybdenum | Ag Silver | Cd (Cadmium) | Lead (Pb) | |||
1 | Lubricant | 299 | 300 | 315 | 307 | 295 | 297 | |||
2 | Lubricant | 300 | 304 | 306 | 305 | 299 | 297 | |||
3 | Lubricant | 305 | 307 | 308 | 306 | 311 | 297 | |||
4 | Lubricant | 299 | 303 | 306 | 306 | 328 | 298 | |||
5 | Lubricant | 304 | 304 | 305 | 324 | 313 | 294 | |||
Sample Content | 300 | 300 | 300 | 300 | 300 | 300 | ||||
Test Average | 301.4 | 303.6 | 308 | 309.6 | 309.2 | 296.6 | ||||
Test Standard DeviationSn | 2.881 | 2.51 | 4.062 | 8.0808 | 13.008 | 1.5166 | ||||
Errorppm | 1.4 | 3.6 | 8 | 9.6 | 9.2 | -3.4 | ||||
Test relative standard deviationRSD | 0.96% | 0.83% | 1.32% | 2.61% | 4.21% | 0.51% | ||||