


This is the third issue of PK Data's BI project. We will showcase our solutions through management challenges, application objectives, deployment architecture, and key application scenarios. Demonstrating our product and service capabilities, PK Data is committed to creating a one-stop enterprise-level BI visualization analysis platform for businesses.
Company Profile
Established on October 18, 1999, the company has, since its inception, benefited from the support of various government levels, the whole of society, and the entire county's population. With a tenacious spirit of struggle and progress, an innovative and pragmatic attitude, and a mindset of scientific development, the entire staff has dared to face difficulties, explored bravely, and continuously innovated. The group has grown from small to large and from weak to strong, maintaining a continuous, healthy, and stable development momentum. Currently, the group has one fully-owned subsidiary and five affiliated companies. Its business scope mainly includes copper mining, selection, smelting, electrolysis, hotel services, real estate development, forestry management, coking products, and magnesium alloy operations. In December 2007, the Wulong Group was recognized as one of the "Top 100 Private Enterprises in Shanxi Province" by the Shanxi Provincial Administration for Market Regulation.
Management Challenges
The Wulong Group is a standard U8 Financial, Supply Chain, and Multi-System user. Unlike traditional single-industry companies, the Wulong Group's operations span multiple sectors including mining, trade, real estate, hotels, smelting, forestry, and commerce. With numerous affiliated subsidiaries, each sector has unique key performance indicators, presenting certain challenges for the group's data analysis and statistics.
The company has accumulated a vast amount of historical data across multiple industries and with numerous business systems. Management urgently needs to integrate and analyze the data from various company systems, then "translate" it into clear, straightforward data presentations for senior management.
Our diverse business systems require a unified data analytics platform.
Data across the group is scattered within various business systems and administrative units, generally meeting the needs of individual units and their respective business applications. However, for centralized control by the group's headquarters, additional resources (human, material, financial, and time) are required for statistics and consolidation.
Collaborative capabilities need enhancement.
The group has numerous subsidiaries, and there exist certain issues such as communication gaps, lack of synchronization, and difficulties in coordination among different units.
Applying Target
Unified Platform, Centralized Management
By implementing a strategy of solidifying foundations, enhancing management, and proceeding step by step, we are constructing a unified, cross-regional analysis and control platform to achieve centralized storage, management, and sharing of the group's data.
Strengthen Internal Controls, Enhance Efficiency
Maximize the overall strengths of the group, promote the integration and coordinated development of internal and external resources within the group, achieve a comprehensive enhancement of the group's management level, and improve the group's management efficiency.
Intelligent Analysis, Supporting Decision-Making
By utilizing the analytical system, we achieve business data visualization, graphically presenting various operational indicators. Through comparisons of actual occurrences versus budgets, we monitor and issue early warnings on the company's budget execution.
Key Business Metrics Monitoring
By analyzing the platform, we have established an early warning mechanism for business risks and can promptly push relevant information to management personnel through various channels.
Application Deployment Architecture
Key Application Scenarios
Overall Application Architecture
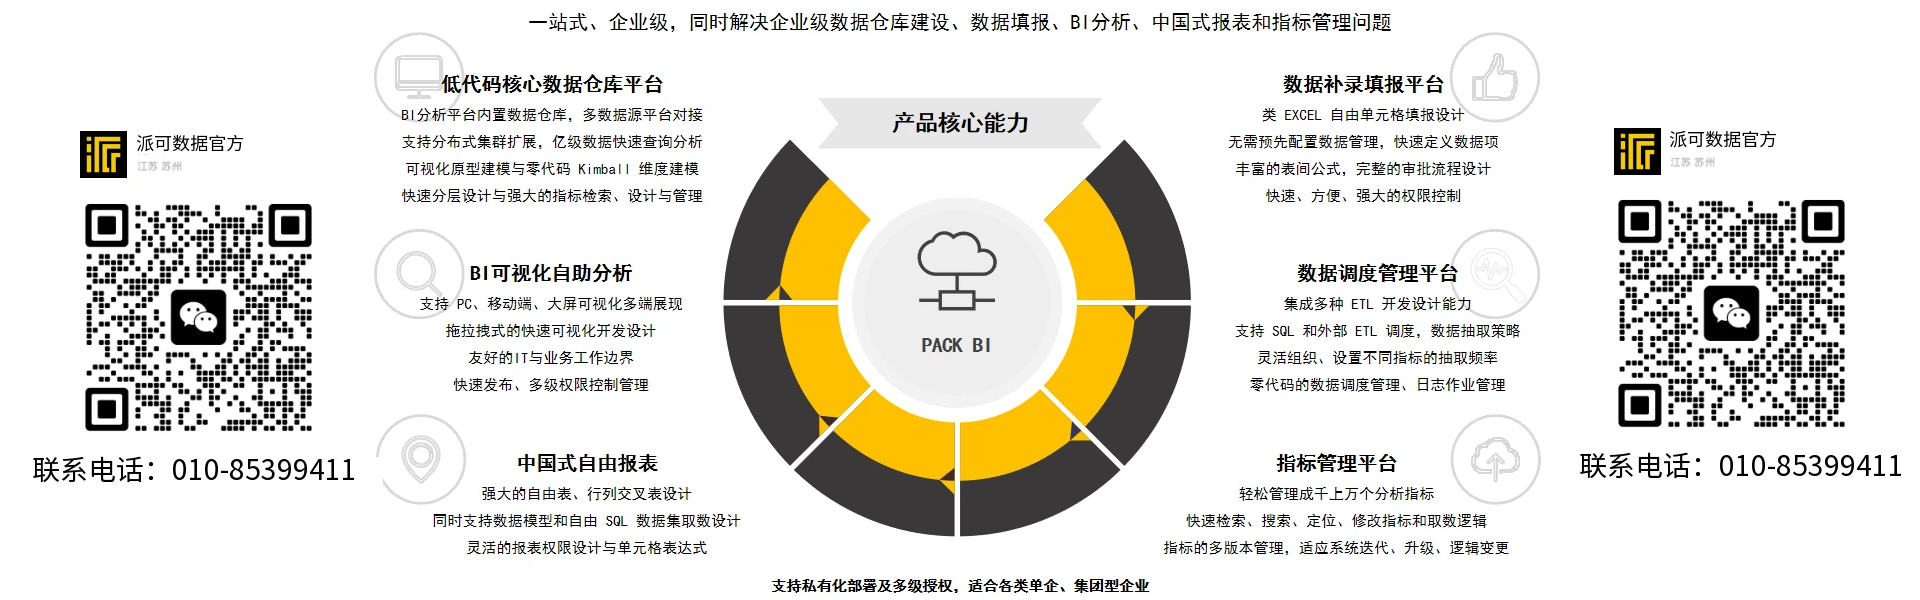
The integration of data from multiple business systems within the group has broken down data silos, unified and standardized the analytical approaches of various branches and subsidiaries. Based on actual customer needs, we have provided analysis content across multiple business modules, completing over 40 pages of analysis display on the PC side and over 20 pages on the mobile side, covering analysis content for the magnesium industry, coal mining, catering, human resources, and hotel sectors.
By leveraging business intelligence as a platform, the consolidation of multiple account sets across the group has been achieved, providing a reliable data foundation for comprehensive and unified management and operational analysis. Daily data extraction and consolidation are realized through the network, offering managers a scientific basis for real-time control of business conditions. On the business intelligence data integration platform, managers can freely and at any time view the operational conditions of their subsidiaries, addressing issues such as long statistical cycles, inaccurate data, poor timeliness, and difficulty in unifying information under the previous reporting model.
● Key Application Scenarios
Restaurant Occupancy and Revenue Analysis
By analyzing the seating occupancy rates in the hotel lobby, we gain insights into the utilization rates of different spaces at various times and locations, as well as year-on-year and month-on-month comparisons and trends. This enables us to effectively predict future occupancy rates and make timely adjustments. Additionally, by conducting direct comparative analyses of revenue at different times, along with trend comparisons, we can promptly understand the relationship between occupancy rates and revenue, ensuring increased profits with increased volume.
Gas Quality Analysis
By analyzing the daily production value of gas, we promptly and effectively gain insights into the daily situations and their comparisons; simultaneously, from day to month, it automatically summarizes and analyzes the monthly and quarterly periods, enabling an effective understanding of the gas situations at different stages and on a daily basis.
Customer Retention Analysis
Analyzing customers is a direct and effective way to boost revenue and generate profits. By monitoring the active status of current customers, timely follow-up and tracking are essential to maintain loyalty and ensure their continued support for our business. Through multidimensional联动 drilling analysis of customers, we gain a comprehensive understanding of their situation.
Processing ore volume and refined copper copper content analysis
An annual and year-on-year comparative analysis of mineral reserves and copper content in refined copper is conducted to overall control production. Simultaneously, by linking each year and product directly to the specific monthly production of that year, a direct and intuitive analysis from the annual to the monthly level is performed. Additionally, by observing trends in year-on-year and month-on-month comparisons, discrepancies are identified.
Mobile App
Stay updated with daily business briefs through the mobile app, unrestricted by time and location. The mobile platform effectively addresses current issues, and the analytical data viewed is indistinguishable from that of traditional PCs, truly achieving timeliness, effectiveness, and efficiency.
Application Value
● Alerts, Report Emails, WeChat Pushes: Real-time transmission of business risk alerts, inventory alerts, and sales alerts to leaders' email and WeChat accounts
● Smart Text: Online Reports, PPT & Word Design, New Perspectives
● Mobile Approval: Reduces Hotel Guest Wait Times, Enhances Approval Response Efficiency
Employee Value: Optimizing Business Model, Standardizing Data Standards, and Enhancing Catering Services
● Efficient Monitoring of Operational Performance: Financial Capital, HR, Marketing, Hotel, Real Estate, and Property Theme Analysis and Monitoring to Support Corporate Operation Control and Management Decision-Making