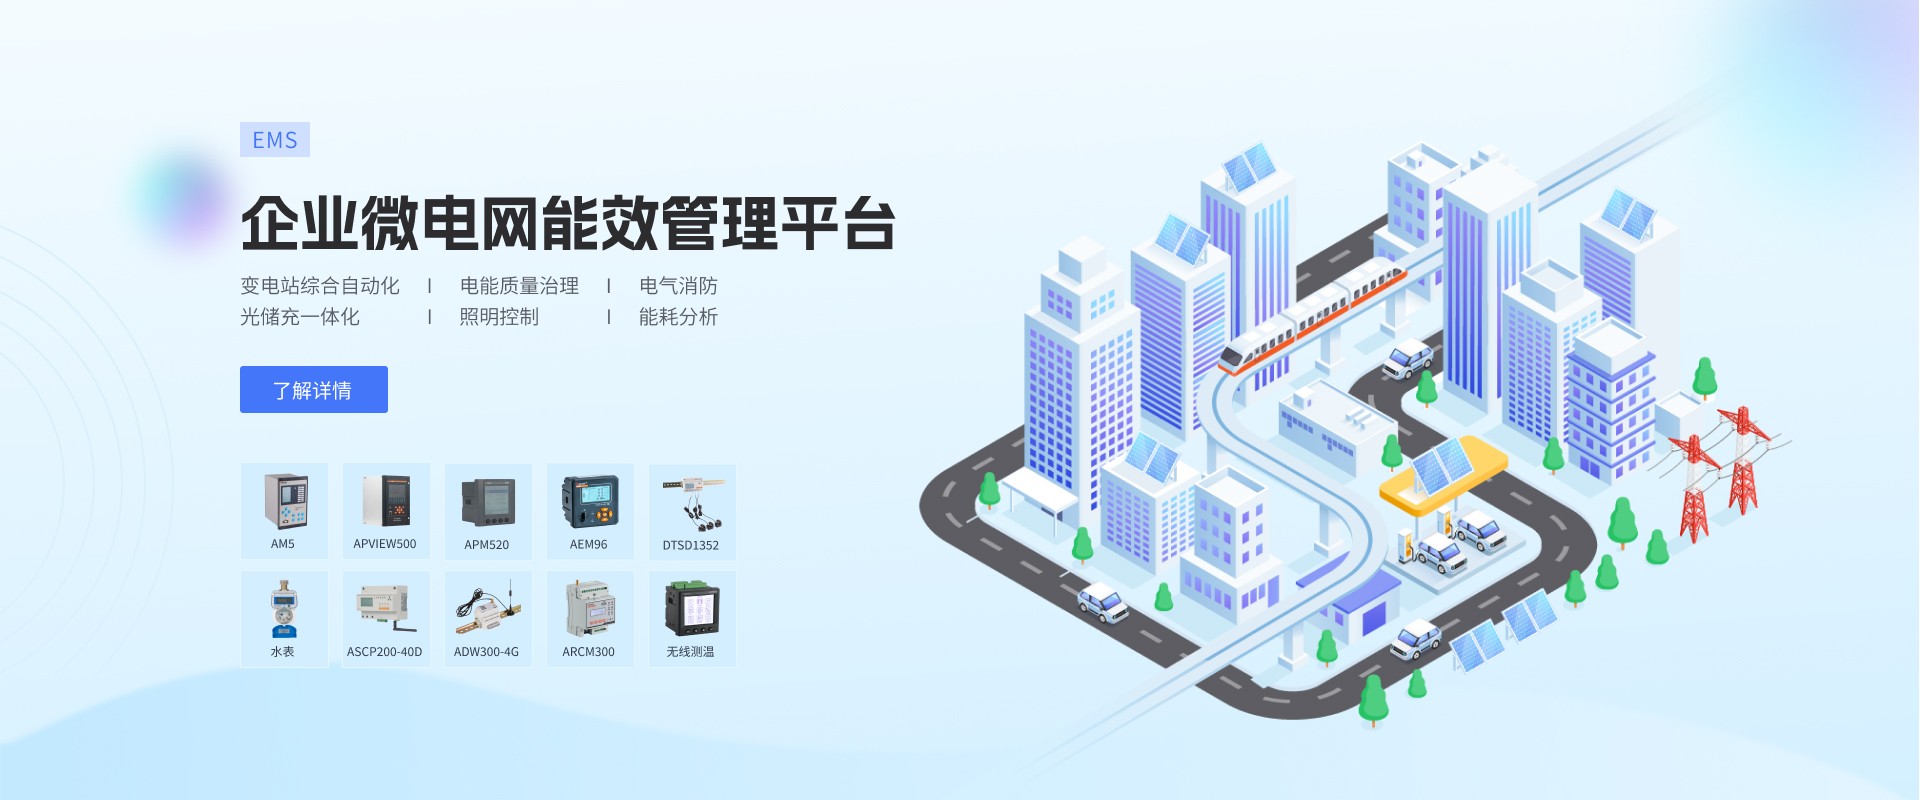

Abstract:The WOES Intelligent Optimization Energy-saving System leverages various信息化 systems of steel mills to construct a visualized energy consumption platform for the steel industry, achieving fine management of energy consumption in the steel sector, enhancing energy efficiency levels across different plants, and reducing energy consumption. In conjunction with the construction and operation of the intelligent optimization energy-saving system for a steel company in Shanxi Province, this article explores the application research of the system in energy consumption statistics, electrical power quality, energy efficiency analysis, idle operation analysis, and comparative analysis. It also analyzes the energy-saving effects brought about by the platform construction.
Keywords:Steel; Analysis and Diagnostics; Energy Conservation Analysis; Energy Efficiency
0 Introduction
As steel enterprises mature in their modernization, their equipment levels and technological processes are equipped with the conditions for integrated energy management systems and intelligent scheduling control. On the other hand, there is a strong demand from enterprises for centralized control of energy systems. Consequently, the construction of energy monitoring and management systems for large-scale steel enterprises is underway at a rapid pace. In recent years, the government has increasingly emphasized energy-saving in the steel industry, enacting a series of regulations and technical specifications related to steel industry energy-saving. These measures promote energy-saving renovations in existing steel enterprises, ensure new steel enterprises meet energy-saving standards, and establish energy consumption monitoring and analysis management systems, driving energy-saving in the steel industry from equipment, technology, and management aspects. Shanxi Province is also actively promoting energy management platforms for high-energy-consuming enterprises across the region to achieve energy-saving and consumption reduction. In April 2021, a certain steel company in Shanxi Province constructed a Wanzhou intelligent optimization energy-saving system. After a year of operation, it has demonstrated significant energy-saving value in steel industry energy management.
1. Scope of Construction
Shanxi's steel company's subsidiary plant consists mainly of iron smelting, steelmaking, rolling, oxygen production, and power generation facilities. The primary energy sources consumed include electricity, tap water, oxygen, nitrogen, recycled water, treated water, coal gas, and steam.
Business managers are still seeking ways to further enhance energy conservation and cost reduction. To strengthen energy monitoring and billing management in the steel mill, the development needs of the overall energy conservation supervision system for the campus, existing equipment monitoring systems, and information systems, as well as the specific requirements of the corporate energy management department, will be fully considered. An intelligent optimization energy conservation system will be constructed to enable automatic energy consumption statistics, fault warnings, and comprehensive energy conservation analysis and diagnosis. This will address existing gaps in energy management, high energy and electricity costs, and issues with peak-shaving management.
By constructing the intelligent optimization system for the enterprise, we have achieved energy classification metering and operation monitoring functions across various factories, providing data support and decision-making basis for future energy management.
(2) Implementing billing management through the WOES system, recording the total gateway bandwidth usage, ensuring accurate revenue and expenditure management, promoting energy conservation, and enhancing staff awareness of energy-saving practices.
(3) The WOES system allows for real-time access to a company's energy management system from anywhere, enabling remote monitoring. It provides effective tools for steel mill energy utilization diagnosis, energy-saving control, energy-saving potential analysis, and energy-saving effectiveness verification.
(4) The platform system's integration and expansion capabilities for various energy consumption systems have been fully considered. Technical preparations for future comprehensive digital factories have been made, with interfaces reserved.
2. System Hardware Design
2.1 Monitoring Point Selection
A total of 355 electricity meters were monitored, with 29 nitrogen and oxygen meters, 7 steam meters, 28 gas meters, 22 recycled water meters, 14 treated water meters, and 19 tap water meters.
2.2 Network Architecture Design
The WOES intelligent optimization energy-saving system utilizes workstations, communication equipment, and measurement and control units as basic tools. It provides a foundational platform for real-time data collection of energy consumption data, switch status monitoring, and remote management and control for enterprises. It can be integrated with detection and control equipment to form any complex monitoring system. The system primarily employs a hierarchical distributed computer network structure, as shown in Figure 1, and is divided into three layers from bottom to top: the equipment layer, information layer, and management layer.
(1) Equipment Layer
Comprised mainly of monitoring equipment and energy data monitoring instruments, it serves as the source of system network data and is also an object of system monitoring. This design monitors the electricity, water, and gas usage at various branches of the steel mill.
(2) Information Layer
The information layer is primarily composed of communication servers, which facilitate data transmission between various layers on-site, enabling the function of data upload and download. It integrates communication signals from on-site energy data monitoring instruments and equipment into the communication servers, and then connects these servers to the WOES intelligent optimization energy-saving system network.
(3) Management
Management is at the core of the system's data and analysis, consisting of data servers, clients, printers, and clients (office computers) within the corporate local area network. Different permissions are allocated according to each individual's responsibilities, ensuring energy management across various factories.
3. System Software Design
Our software function design focuses on monitoring and analyzing key energy-consuming points, establishing an energy monitoring and analysis platform for the enterprise. The platform operates the energy monitoring and analysis system software, monitoring real-time energy consumption of equipment across various factories, analyzing historical energy data, issuing early warnings for electrical quality and abnormal equipment operation issues, and examining leaks and waste during the energy use process.

Figure 1: WOES Intelligent Optimization Energy-Saving System Network Structure Diagram
3.1 Energy Consumption Overview
The Energy Consumption Overview primarily displays users' energy usage, providing a bird's-eye view of the campus's current energy consumption status and data changes in a map style. This feature presents electricity consumption, specific energy consumption, and other functions through a list within a 3D map. Senior management and leaders of various branches can use this feature to view the energy consumption and specific energy consumption of the company and its branches in real-time, gaining an understanding of the overall energy usage of the entire company or individual branches.
3.2 Energy Consumption Statistics
The WOES system collects raw binary data from meters on-site and parses it into readings and energy data based on device configuration. It then arranges these parameters into a real-time data list for user viewing, allowing for a direct understanding of building energy consumption. By utilizing the energy consumption statistics function of the WEOS intelligent energy-saving optimization system, workload can be reduced, meter reading accuracy can be increased, and work efficiency can be enhanced.
3.3 Power Quality Analysis
The WOES system evaluates the pass rates for voltage, frequency, unbalanced three-phase voltage, voltage fluctuations, and total voltage harmonic distortion across various voltage levels.
The analysis of voltage harmonic distortion rates, including odd and even harmonics, and current harmonic distortion rates, is conducted in both graphical and tabular formats. By monitoring the electricity consumption of enterprises over a specific period, we provide users with an analysis of frequency deviation, voltage unbalance, transformer economic operation, line loss rate, power factor, and harmonic content, enabling them to understand the current quality of electrical energy.
By analyzing power quality, the sources of pollution can be pinpointed. Based on the results of the power quality analysis, harmonic treatment can be implemented to keep harmonics within a range that does not disrupt the normal operation of other equipment. After harmonic treatment, the power quality analysis function can also be used to verify the effectiveness of the harmonic treatment.
3.4 Energy Efficiency Analysis
The energy efficiency analysis under this function module is based on the energy efficiency assessment standards of various iron and steel plants in the steel industry, calculating data indicators such as electricity consumption per ton of iron and per ton of steel. Meanwhile, the WOES system compares the control values of each plant with those of the enterprise and the industry, automatically identifying points of abnormal energy efficiency, and providing detailed data analysis to help users identify the causes of abnormal energy consumption in areas with abnormal energy efficiency, and to offer references for energy-saving measures. The idling analysis is configured according to the main and auxiliary equipment relationships in the enterprise's on-site operations, monitoring energy losses and idling duration caused by equipment idling, and providing detailed alarm information for users to enhance control and standardize the behavior of operation personnel. The electricity cost-related module compiles the billing situation of the enterprise and the total reporting gateway, separately monitoring and analyzing the three electricity cost methods: basic electricity cost, kilowatt-hour electricity cost, and power factor adjustment electricity cost, to strengthen the enterprise's electricity cost management.

Figure 2 Ironmaking Plant Energy Consumption Analysis
3.5 Analysis and Diagnosis
The function module enables real-time monitoring of major energy-consuming equipment across various factories, triggering relevant real-time alerts based on different alarm strategies. The generated alarm records facilitate the identification of abnormal causes and the documentation of the process by the responsible personnel for each corresponding device, implementing issue tracing and root cause analysis. This aids in effective control of energy-consuming equipment, thereby achieving the goal of reducing energy consumption.
3.6 Alarm Management
By setting the upper and lower limits as well as the standard values for the operational parameters of the analysis objects, we provide safety early warning protection for the distribution network and equipment. This ensures that alarms or timeouts trigger safety alerts, leading to secure and efficient operation of both equipment and the distribution network. The event record query system displays the status and records of real-time and historical alarms for each device. When selecting "historical alarms," users can choose a time range, alarm category, device name, confirmed user, and confirmed computer to search for historical data. For "real-time alarms," the system showcases existing real-time alarms, reminding users to address them promptly.
3.7 Information Inquiry
Users can select all monitored devices by the system, view all monitoring parameters, and set the start and end times of the query as well as the time interval. The query results can be exported, saved, and printed. The historical data query function provides data support for accident tracing, abnormal analysis, and energy consumption supervision.
4. Application Effects
(1) Seeking energy consumption units commonly used in the refining and processing plant. As shown in Figure 2, the energy consumption statistics eliminate the abnormal energy consumption by sequentially searching for用电 anomalies based on the organizational structure tree of the enterprise. If an abnormal energy consumption is detected at a specific node on a particular day, further investigation into abnormal energy consumption in sub-regions beneath that node can be conducted.
(2) The intelligent optimization energy-saving system for a steel company in Shanxi Province identified a management gap in its idling analysis module (as shown in Figure 3). As depicted in Figure 3, there was equipment idling during the period, resulting in an energy loss of 1488kWh. Strengthening control measures could save nearly 700 yuan in electricity costs.

Figure 3: Desulfurization Fan in Idle Operation
5. AcrelEMS-SEMI Semiconductor Factory Energy Management Platform
5.1 Platform Overview
The AcrelEMS-SEMI Electronic Factory Energy Management Platform integrates substation comprehensive automation, power monitoring, power quality analysis and treatment, electrical safety, energy consumption analysis, lighting control, and equipment maintenance and operation. It provides data support for establishing a reliable, secure, and efficient factory energy management system. It also introduces technology, complements facility system optimization, simplifies overall plant management, optimizes energy efficiency with real-time data, prevents risks, ensures stable operation and high yield of key manufacturing equipment, reduces comprehensive costs, and ultimately achieves the goal of efficient operation and manufacturing.
5.2 Platform Composition
The AcrelEMS-SEMI Electronic Factory Management System by Ankelei is a deeply integrated automation platform that encompasses power monitoring systems, substation comprehensive automation, power quality monitoring and treatment, electrical fire monitoring systems, fire equipment power supply systems, fire door monitoring systems, fire emergency lighting and evacuation guidance systems, intelligent lighting control systems, energy consumption monitoring systems, new energy charging stations, and pre-paid systems. Users can access data through browsers and mobile apps, enabling centralized monitoring, unified management, and scheduling of the electrical usage and safety in the electronic factory from a single platform, while meeting the requirements of reliable, safe, stable, efficient, and orderly power usage in the factory.
5.3 Platform Topology Diagram

6. Platform Subsystem
6.1 Electric Power Monitoring
Electricity monitoring primarily targets 10/0.4kV overhead or underground transformer substations, providing protection and monitoring for the transformer substation's high-voltage circuit configurations with micro-computerized protective devices and multifunctional instruments. It also configures multifunctional metering instruments for the 0.4kV outgoing lines, used for measuring and controlling the electrical parameters and energy consumption of the outgoing circuit. It allows for real-time monitoring of switchgears, transformer micro-computerized protective and control devices, generator control panels, ATS/STS, UPS systems, including remote control, remote signaling, remote measurement, remote adjustment, accident alarms, and records.

6.2 Power Quality Monitoring and Management
Monitor the power quality of each incoming circuit, including data waveforms such as voltage dips, harmonic distortion, and flicker, to determine the disturbance direction of the distribution system.
Equipped with active filters and reactive compensation devices to compensate and improve the power quality on the 0.4kV side, and to monitor the operation of the active filters and reactive compensation devices, ensuring that the power quality meets production requirements.


6.3 Substation Comprehensive Automation
The Substation Integrated Automation System is primarily designed for 110kV substation, 10kV transformer stations, and 10kV diesel generator sets. By setting up the Acrel-1000 Substation Integrated Automation System Substation at the substation, it achieves local telemeasuring, telesignaling, telecontrol, alarm, and reporting functions, and uploads the data to the AcrelEMS-SEMI Energy Management Platform for centralized monitoring and alarm.

6.4 Electrical Safety
The AcrelEMS Energy Management System for electronic factory plants is equipped with electrical fire sensors, temperature sensors, fire equipment power sensors, and fire door status sensors for electrical safety hazards in the distribution system. It connects to the status display of fire emergency lighting and indicator lights in real-time, and also monitors the battery temperature and internal resistance of the UPS in real-time. It provides timely warnings through sound, light, SMS, and APP in case of anomalies.

6.5 Smart Lighting Control
Single Control, Area Control, Automatic Control, Sensor Control, Timer Control, Scene Control, Dimming Control, and a variety of other control methods.

6.6 Energy Consumption Analysis
AcrelEMS's Electronic Factory Energy Management System establishes a measurement system for factories, displaying the flow and loss of energy. It helps enterprises analyze the destination of energy consumption through energy flow diagrams and identify abnormal areas of energy consumption. By utilizing dimensions such as energy use types, monitoring areas, workshops, production processes, operations, work time, equipment, teams, and sub-items, the system employs various methods like curves, pie charts, histograms, cumulative charts, and digital tables to statistically analyze factory energy usage, year-on-year and month-on-month comparisons, and actual performance. It also conducts benchmark comparisons, energy consumption per unit of product, and energy consumption per unit of output, identifying inefficiencies and unreasonable aspects in the energy use process. This enables the adjustment of energy allocation strategies and reduces waste during energy consumption.

6.7 Electric Charging Station Management
Electric vehicle and battery-powered vehicle charging station management, including fee management and asset management.

6.8 Employee Dormitory Management
The company has implemented load management within the employee dormitories, including the identification and management of harmful loads and load threshold management, to prevent fires caused by harmful loads. Electricity and water charges are managed for the dormitories, supporting payment methods such as WeChat and Alipay, and energy consumption data of the dormitories is collected.
 7Summary
Establishing a comprehensive energy management system is not merely a reflection of the improvement in automation and informatization technology levels. It plays a crucial role in the overall energy management of the enterprise. It can unify scheduling, optimize gas balance, reduce gas emissions, enhance environmental protection quality, lower energy consumption per ton of steel, and improve labor productivity. Moreover, it significantly impacts the formulation and execution of emergency response plans, the rapid analysis of accident causes and timely judgment and treatment, the reasonable adjustment and balance of energy supply and demand, and the analysis of energy performance based on objective information.
Reference:
Zhang Wenliang. The Establishment and Application of Energy Management System in Baosteel Ironmaking Plant [D], Fudan University, 2012.
Wang Zhongyi, Ye Ruihai. Application of Energy Management Systems in Iron and Steel Enterprises [J]. High-Tech Enterprise of China, 2012(21): 4.
Ling Zhenhua. Research on Energy Management Information System of Steel Enterprises [D], 2005.
Wang Keng. Application of Energy Management Systems in the Steel Industry
Ankorri Enterprise Microgrid Design and Application Handbook, 2022.05 Edition
