
Summary:Based on the on-site investigation of a large shopping mall in Shanghai, a proposal is put forward to improve the mall's energy consumption management by constructing a cloud-based energy management system. Firstly, we thoroughly collect building information and equipment operating conditions, design a reasonable system implementation plan, address data collection and transmission obstacles on-site, complete the construction of the cloud-based energy management system, and successfully achieve stable operation, enhancing the mall's operational management efficiency. Secondly, based on the statistical results of the cloud-based energy management system and in line with the actual needs of energy-saving projects, we conduct secondary R&D and innovation on the existing functions, designing a device energy consumption timing feature and completing on-site tests. This provides a scientific basis for the evaluation of future energy-saving renovation projects and project acceptance.
Keywords:Cloud Energy Consumption Management System; Information Collection; System Implementation Features; Timekeeping
Introduction
Currently, energy consumption management systems have been extensively researched and applied in steel production, power generation, refined oil pipeline, and large public buildings. The high energy consumption characteristics of large public buildings have always been a major social concern. The energy consumption per square meter in large shopping malls is significantly higher than that in hotels, restaurants, office buildings, and mixed-use commercial buildings, due to the long energy transmission distance of central air conditioning systems and the use of full-air systems. Moreover, these buildings operate for long hours, typically more than 12 hours a day, without distinction between workdays and rest days.
Cloud Energy Consumption Management System
This study applies an energy consumption management system to a large shopping mall in Shanghai, completing the system design and implementation, and analyzing the mall's energy consumption patterns.
The shopping mall energy consumption management system is primarily designed in accordance with the "Technical Code for Energy Monitoring System of Public Buildings" in Shanghai.
1.1 Information Collection
1.1.1 Building Information
The mall, transformed from an old factory built in the 1980s, began operations in June 2012. The total floor area of the mall is
110401m², with a total of 23,594m² for catering and 34,937m² for shopping mall. The floor area of each functional building is listed in Table 1.
Shown.
Energy Consumption Information
The mall's classified energy consumption includes water, electricity, and natural gas. The primary consumers of water and natural gas are catering buildings. The energy consumption of catering buildings is managed and operated by catering companies, with the energy management system only recording the total monthly energy consumption data. The electrical equipment in the club mainly includes lighting and split central air conditioning systems.
In summary, the mall has 18 central air conditioning units, all featuring a 2-pipe primary pump design. Schneider's building automation system has been installed, with monitoring computers housed in the monitoring room.
1.2 System Implementation
Based on the principle of itemized energy consumption classification, a two-level metering scheme is implemented to monitor the energy consumption of the shopping mall. Firstly, it is divided by building sections, and secondly, by building floors or functional areas (specific to mall buildings). The information center is located in the office of the Engineering Department on Building 5.
1.2.1 Issue Identified
Server management systems require a certain level of computer literacy among personnel, necessitating both human and financial investments. The 54 three-phase smart meters at data collection points gather five pieces of data: voltage, current, peak, valley, and average electricity consumption. The large volume of data collection demands high accuracy, rigorously testing the data collector's and energy consumption system's collection and data processing capabilities. The scattered collection points and long transmission distances result in significant signal attenuation. The smart water meters are distributed, leading to higher costs for data collection wiring. The Schneider Building Automation System (WorkplacePro) provides data such as end-point temperatures and start/stop times, and data sharing requires addressing issues related to data interfaces and transmission.
1.2.2 Solution
We have chosen a B/S architecture cloud energy consumption management system, with the system server managed by a professional team, ensuring stability, security, and reliability. The main equipment on-site includes intelligent meters and communication management units. The data from the communication management units is uploaded to the cloud server via the mall's TCP/IP network. The system utilizes industrial-grade data collection communication management units, equipped with 4 RS232/485 ports and 2 Ethernet ports (optional with GPS module configuration). Each port corresponds to a 485 bus, with a load limit of less than 32 devices to ensure communication quality. The communication management unit also features data collection, storage, and forwarding capabilities, supporting offline storage and resume transmission (equipped with a 2G SD card). Various technologies are employed to ensure the security of on-site equipment data, including restricting data access IP addresses and setting read/write permissions for measurement points. A data collection scheme by grouping is adopted, such as grouping the 3rd, 4th, 5th, and 6th as one group, with the bus transmission distance for each group less than 1200m, simultaneously satisfying the bus load with less than 32 devices. For instance, 7# parking lot is located far from the mall with difficult wiring. Field tests showed that the wireless signal (radio frequency) transmission method had to penetrate many walls, and the parking lot walls were brick and concrete structures with strong signal blocking, causing significant signal attenuation, making data transmission almost impossible within the parking lot, and the communication quality was not up to standard. After multiple field tests, the GPS signal transmission solution was finally chosen to upload parking lot energy consumption data. A separate communication management unit is provided for 7#, directly uploading GPS data to the cloud server. The intelligent water meter chosen is a wireless remote transmission intelligent water meter, supporting Modbus RTU standard protocol. A data concentrator is added between the intelligent water meter and the communication management unit, using wireless transparent transmission technology to extend the transmission distance of water meter data. The energy consumption management system requires collecting indoor and outdoor temperatures and central air conditioning start/stop data, with data sources from the building automation (BA) system. After several site inspections by engineers, and confirmation from Schneider engineers, it was determined that the existing UNC switch network ports could be utilized, and the BA system's configuration tool could be used to enable BACnet functionality, selecting indoor and outdoor temperature and start/stop signal data, and making it available to the energy consumption management system. The communication management unit is connected to the UNC switch via an Ethernet cable, forwarding the collected data to the cloud energy consumption management system.
2. Cloud Energy Consumption Management System Features
- The Energy Consumption Overview is primarily aimed at senior management, offering a comprehensive view of mall energy consumption, including per-square-meter energy consumption, carbon emissions, energy consumption rankings, energy costs, and their composition. It displays the real-time or weekly, monthly, or annual trends of categorized energy consumption.
- Data analytics includes item-level analysis, regional analysis, meter reading queries, and energy consumption rankings. Managers can selectively query mall energy consumption based on time, item, and regional conditions. The meter reading query feature provides users with the ability to retrieve historical data of all smart meters' voltage, current, and peak-valley-even energy consumption, displaying historical change curves. Time ranges from seconds to hours, and users can freely set the time range as needed.
- Alarm management records any abnormal conditions of measuring equipment and abnormal power consumption of energy-consuming equipment. Managers and engineers can view historical abnormal records based on categories and time conditions.
- The Unit Information Display project showcases the basic details of the unit and its individual buildings. This includes basic information sections, additional items information sections, and remarks information sections. The mall comprises multiple buildings, which can be filtered through a dropdown menu.
- Utility consumption reports are now conveniently accessible for managers to view the power usage of the mall. The report is divided into five sections: meter reading records, branch power consumption, comprehensive statistics, project reports, and energy consumption timing. After selecting relevant conditions, clicking the "Preview" button displays the report, and clicking the "Export" button allows the report to be exported in Excel format for easy editing and printing.
The timing function is a secondary research and design feature developed based on the energy consumption management system functions, combining the engineering application experience of energy-saving companies. There is no additional hardware investment required. The calculation of energy-saving amount in the EMC contract energy management lighting energy-saving transformation effect evaluation indicators requires two important parameters: lighting load and lighting time. The lighting load can be calculated based on the number and power of lighting fixtures statistically recorded on-site, while the lighting time is usually determined by the agreed method between the parties, which is prone to disputes and cannot change with factors such as weather, seasons, and customer flow (malls), leading to discrepancies from the actual lighting time.
The timing function for the central air conditioning system's operation time utilizes the start and stop data from the BA system to calculate the running time of the air conditioning system. The lighting timing function determines the switching status of circuit lighting based on the increasing slope of active electrical energy and counts the time the lighting fixtures are on. If the smart meter measures a single circuit, such as the outdoor lighting circuit of the following light box, it only needs to determine if the increasing slope is greater than 0. If it measures multiple circuits, it is necessary to first understand the daily combination pattern and approximate switching times of the circuits, combined with the lighting load of the circuits or the historical active energy change curve, to determine the increasing slope of active energy when each switch combination is activated. A reasonable threshold is then set as the basis for circuit switching judgment. If the smart meter is a single-phase meter, the switching status of the lighting circuit can be directly determined by the change in current.
6) Personal Settings for configuring user preferences. Users can modify their basic information on this page.
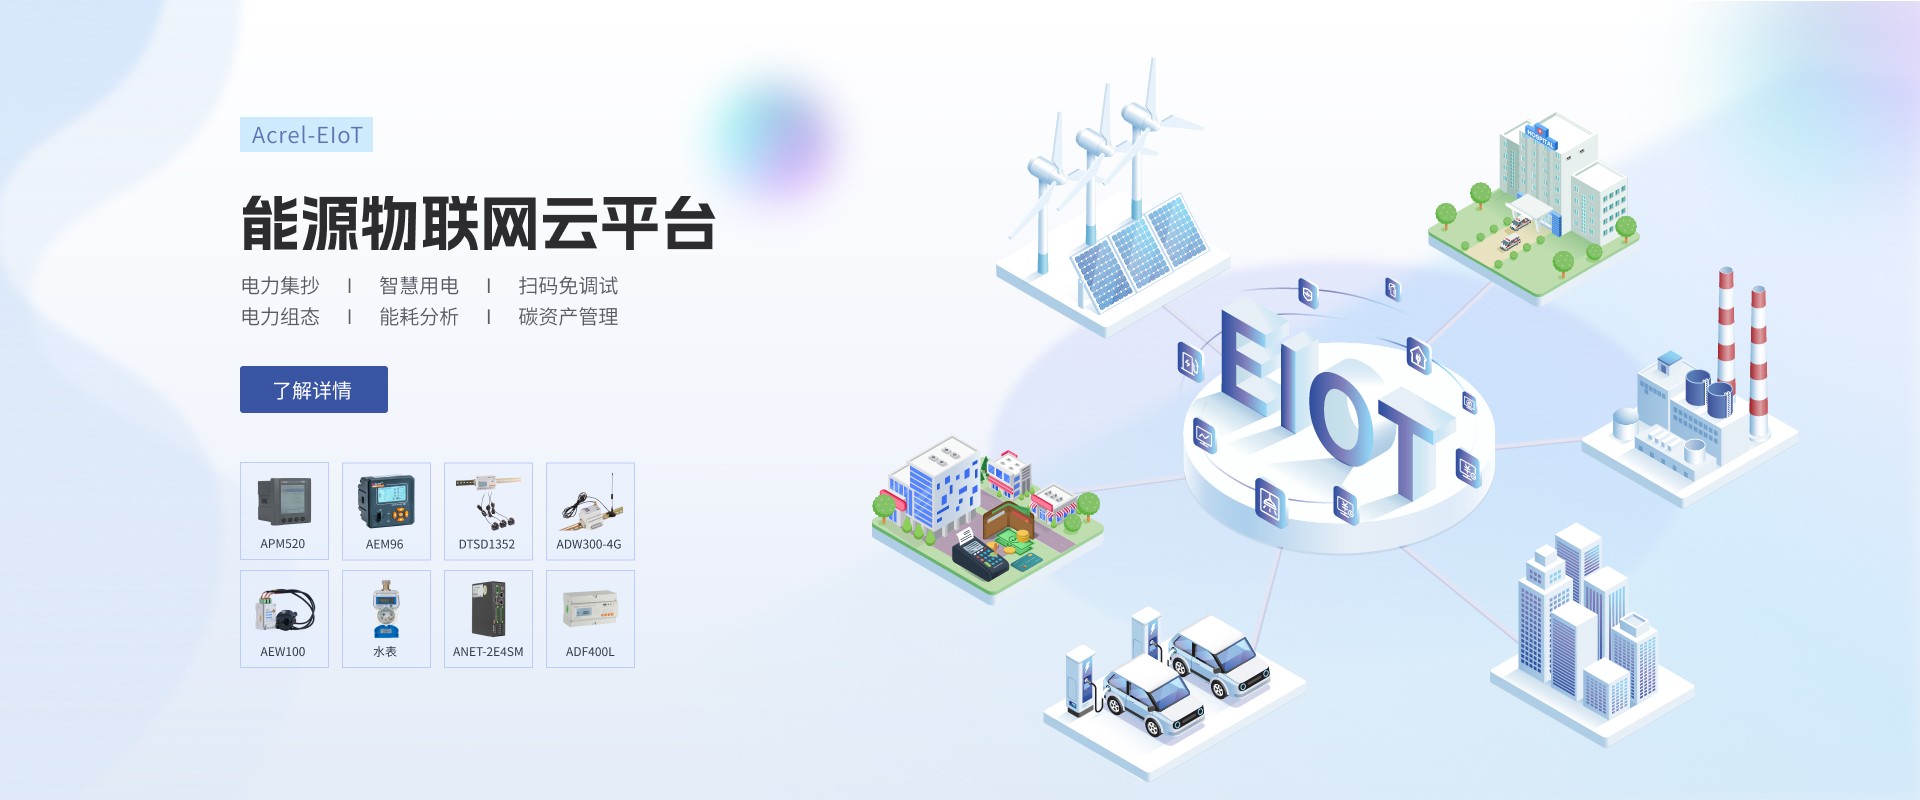
3. Acrel-EIOT Energy Internet of Things Cloud Platform
3.1 Overview
The Acrel-EIoT Energy Internet of Things Open Platform is a system based on an IoT data platform, establishing unified upstream and downstream data standards, and providing energy IoT data services to internet users. Users simply need to purchase Acrel IoT sensors, select optional gateways, install them independently, and scan to use their mobile phones and computers to access the required industry data services.
The platform offers functionalities such as data dashboard, electrical safety monitoring, power quality analysis, energy consumption management, pre-paid management, charging station management, intelligent lighting management, alarm and record of abnormal events, and operation and maintenance management, while supporting multi-platform, multi-language, and multi-device data access.
3.2 Application Locations
This platform is suitable for apartment renters, chain convenience stores, small factories, building management system integrators, small property management companies, smart cities, substation transformation and distribution stations, buildings, communication base stations, industrial energy consumption, intelligent lighthouses, and power operation and maintenance fields.
3.3 Platform Structure

3.4 Platform Features
Electricity Collection and Reading
The Power Collection and Reading Module can facilitate the query, analysis, early warning, and comprehensive display of various monitoring data, ensuring an environmentally friendly power distribution room. In terms of intelligence, it achieves remote measurement, remote signaling, and remote control of the power supply and distribution monitoring system, providing comprehensive detection and unified management of the system. In data resource management, it can display or query the operation of various equipment within the power distribution room (including historical and real-time parameters) and allows for daily, monthly, and annual report queries or prints based on actual conditions, enhancing work efficiency and saving human resources.
Transformer Monitoring
Power distribution diagram
Energy Consumption Analysis
The Energy Consumption Analysis Module utilizes automation and information technology to achieve automated and scientific management throughout the entire process, from energy data collection, process monitoring, energy medium consumption analysis, to energy consumption management. It organically combines the entire process of energy management, production, and usage, employing advanced data processing and analysis techniques for offline production analysis and management. This ensures unified dispatch of the entire factory's energy system, optimizes energy medium balance, effectively utilizes energy, improves energy quality, reduces energy consumption, and aims to achieve energy conservation and reduction, as well as enhance overall energy management levels.
Energy Consumption Overview
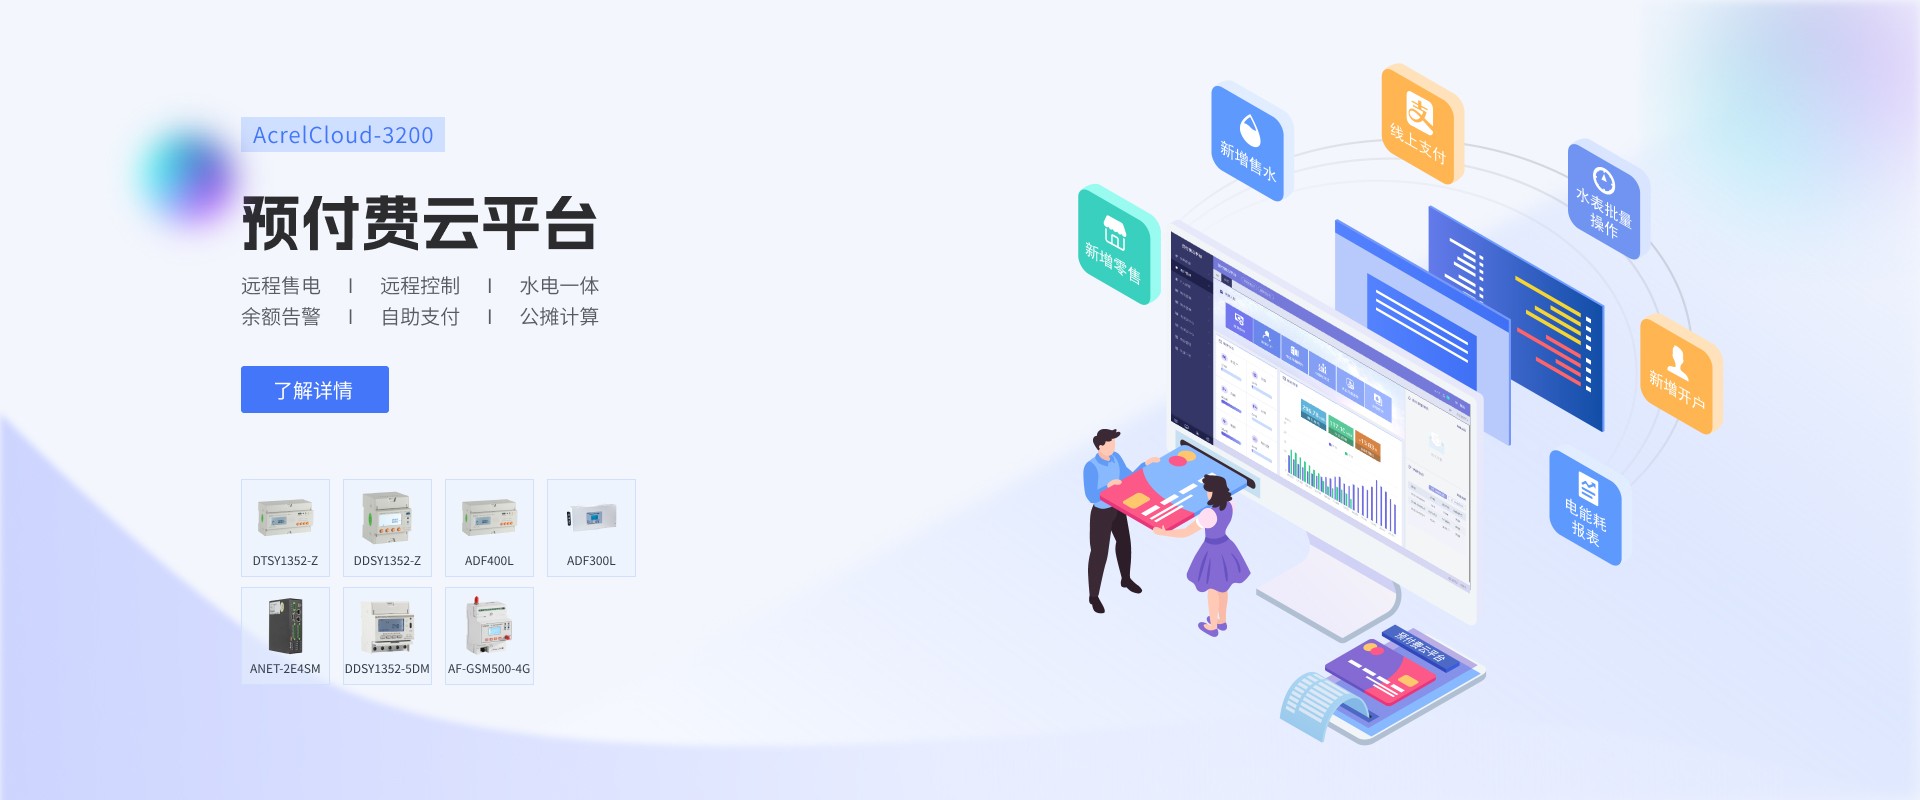
Pre-paid Management
1) Login Management: Manage operator accounts and permission allocation, view system logs, and more.
2) System Configuration: Configure for buildings, communication management machines, instruments, and default parameters.
3) User Management: Performs operations such as account opening, account closing, remote switching, batch processing, and record inquiries for store users.
4) Electricity Sales Management: Provides remote operations for electricity sales, returns, corrections, and record inquiries for meters that have been registered.
5) Water Sales Management: Remote operations for water sales, returns, and record inquiries for accounts already activated.
6) Reporting Center: Offers inquiries for electricity and water sales financial reports, energy consumption reports, alarm reports, etc. All reports and records inquiries within this system support export in Excel format.
Pre-Paid Dashboard
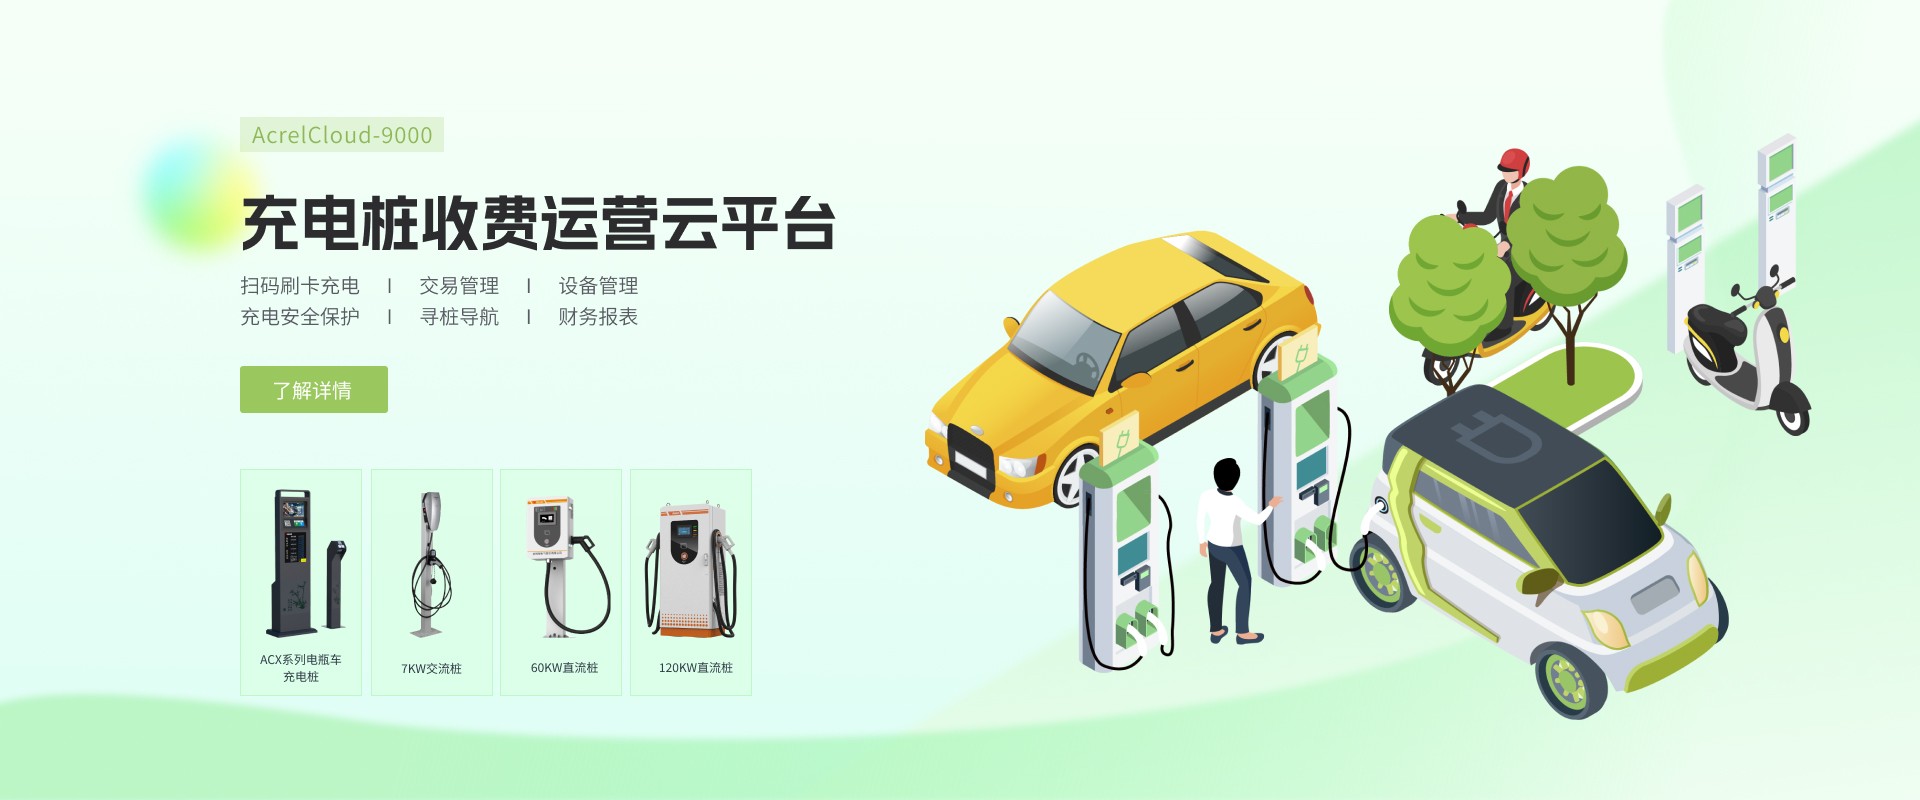
◆ Electric Vehicle Charging Station Management
Through Internet of Things technology, the system continuously collects and monitors data from charging station sites and individual charging stations. It also provides early warnings for a range of faults, including over-temperature protection of charging machines, over-voltage and under-voltage of charging machine inputs and outputs, insulation detection failures, and more. The cloud platform encompasses all functionalities related to charging fees and charger operation, including city-level large screens, transaction management, financial management, transformer monitoring, operational analysis, and basic data management.
EV Charging Station Dashboard
Smart Lighting
Smart lighting continuously monitors the power status of lighting circuits, including indoor lighting and city streetlights, across various urban areas through the Internet of Things technology. It also allows for scheduled on/off strategy configurations, remote backend management, and mobile management, thereby reducing the maintenance difficulty and costs of streetlight facilities, enhancing management levels, and achieving energy-saving and emissions-reduction effects.
Monitoring Page
Electrical Safety
Electrical safety is achieved through timely inspections and rectifications, aiming to eliminate potential hazards of electrical fires and achieve the goal of "preventing fires before they start."
Smart Fire Protection
Through cloud platform-based data analysis, mining, and trend analysis, we assist in achieving scientific fire prevention early warnings, grid management, and the implementation of multi-dimensional responsibility supervision. This addresses the previous gaps in effective monitoring of "small, medium, and micro enterprises" and hazardous chemical production facilities, adapting to all public and private buildings. It achieves unmanned, intelligent fire protection, meeting the practical needs for intelligent fire protection's "automation," "intelligentization," "systemization," and "refined" electricity management.
4. Closing Remarks
The project introduces the cloud concept into the energy consumption management system, integrating the engineering specifications of Shanghai's energy consumption management system. Based on on-site survey results, the project optimally utilizes the existing conditions of the shopping mall to design the system implementation plan and complete the construction and operation of the energy consumption management platform. According to preliminary operation results, an innovative timekeeping function for the air conditioning and lighting equipment of the system has been developed, which on one hand enhances the system's functionality, and on the other hand facilitates the assessment of the energy-saving renovation project's effectiveness. Currently, the shopping mall's cloud-based energy consumption management system has passed the acceptance test and is operating normally.
References
Wei Qingpeng, Zhang Xiaoliang, Wang Yuan, et al. Current Energy Consumption Status and Main Energy-saving Strategies in Large Shopping Malls in Beijing [J]. Heating, Ventilation and Air Conditioning, 2006, 36(Issue): 114-118.
Ling Jing, Li Hongchen, Shi Chunhui, Jiang Wenrong. Application of Cloud Energy Consumption Management System in a Large Shopping Mall
[3] Enterprise Microgrid Design and Application Handbook, 2022.05 Edition.
